Fig. 1
Download original image
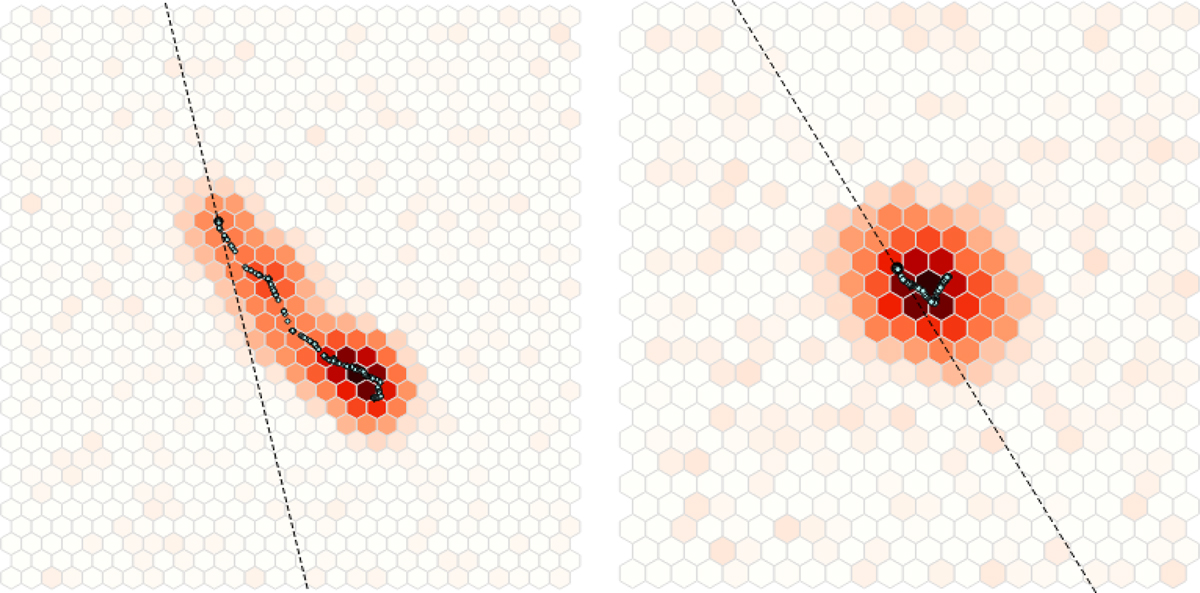
Example of a photoelectron track generated by a 7 keV photon (left panel) and a 3.5 keV photon (right panel). The dashed lines and the black points represent respectively the simulated PE emission direction and X-ray impact point. The simulated photoelectron path is reported as well. Ionization charges created along the photoelectron path are reported as small cyan dots. The color scale, going from white to dark red, represents the amount of charge collected in each pixel.
Current usage metrics show cumulative count of Article Views (full-text article views including HTML views, PDF and ePub downloads, according to the available data) and Abstracts Views on Vision4Press platform.
Data correspond to usage on the plateform after 2015. The current usage metrics is available 48-96 hours after online publication and is updated daily on week days.
Initial download of the metrics may take a while.