Fig. 9.
Download original image
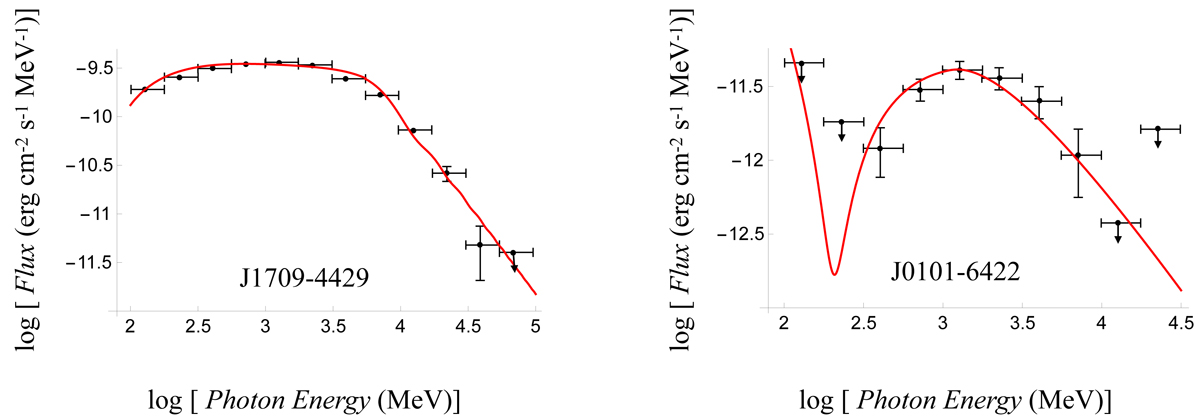
Phase-averaged γ-ray spectra of PSR J1709−4429 and PSR J0101−6422. The data are from the Second Fermi-LAT Catalog of γ-ray Pulsars (Abdo et al. 2013). The red curves are plots of the spectral distribution function described by Eq. (4) for the parameters given in Eqs. (10) and (11).
Current usage metrics show cumulative count of Article Views (full-text article views including HTML views, PDF and ePub downloads, according to the available data) and Abstracts Views on Vision4Press platform.
Data correspond to usage on the plateform after 2015. The current usage metrics is available 48-96 hours after online publication and is updated daily on week days.
Initial download of the metrics may take a while.