Fig. 8.
Download original image
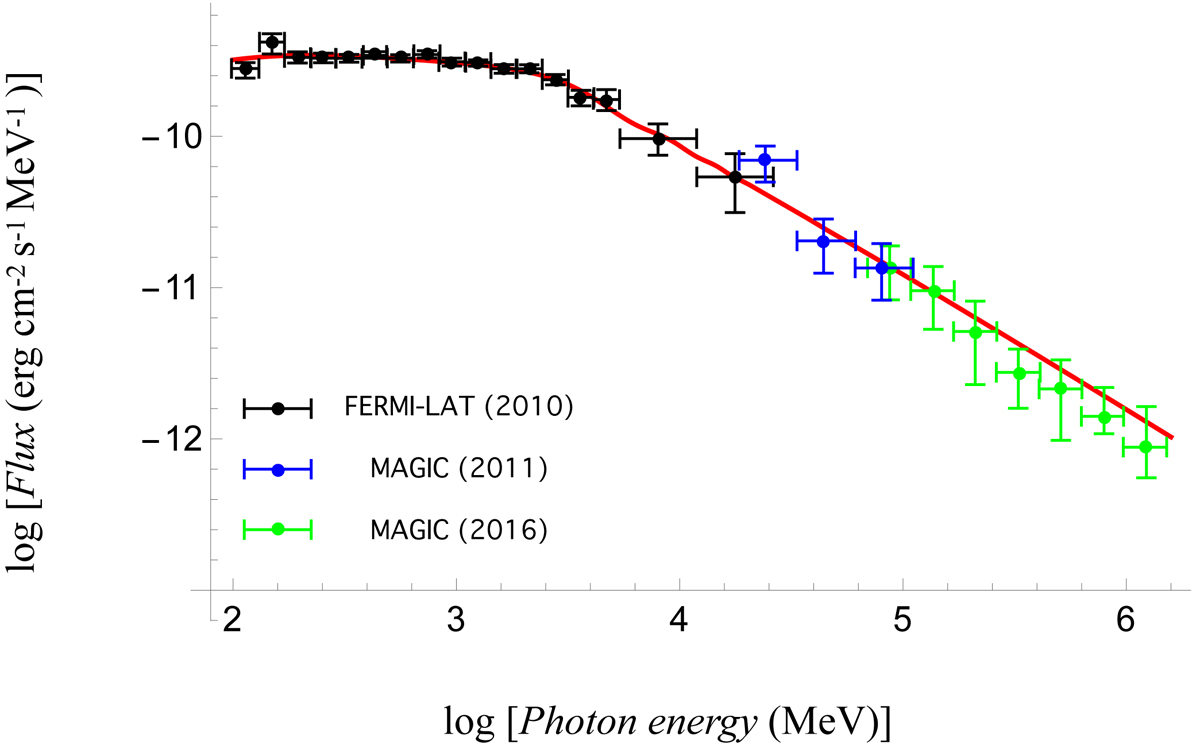
Phase-averaged γ-ray spectrum of the Crab Pulsar. The Fermi-LAT data points below 25 GeV (black) are those reported in Abdo et al. (2010). The MAGIC data points between 25 and 100 GeV (blue) are those reported in Aleksić et al. (2011). The MAGIC data points beyond 100 Gev (green) are extracted (via the procedure described in Sect. 4) from those reported by Ansoldi et al. (2016). The red curve is a plot of the spectral distribution function described by Eq. (4) for the parameters given in Eq. (9).
Current usage metrics show cumulative count of Article Views (full-text article views including HTML views, PDF and ePub downloads, according to the available data) and Abstracts Views on Vision4Press platform.
Data correspond to usage on the plateform after 2015. The current usage metrics is available 48-96 hours after online publication and is updated daily on week days.
Initial download of the metrics may take a while.