Fig. 4.
Download original image
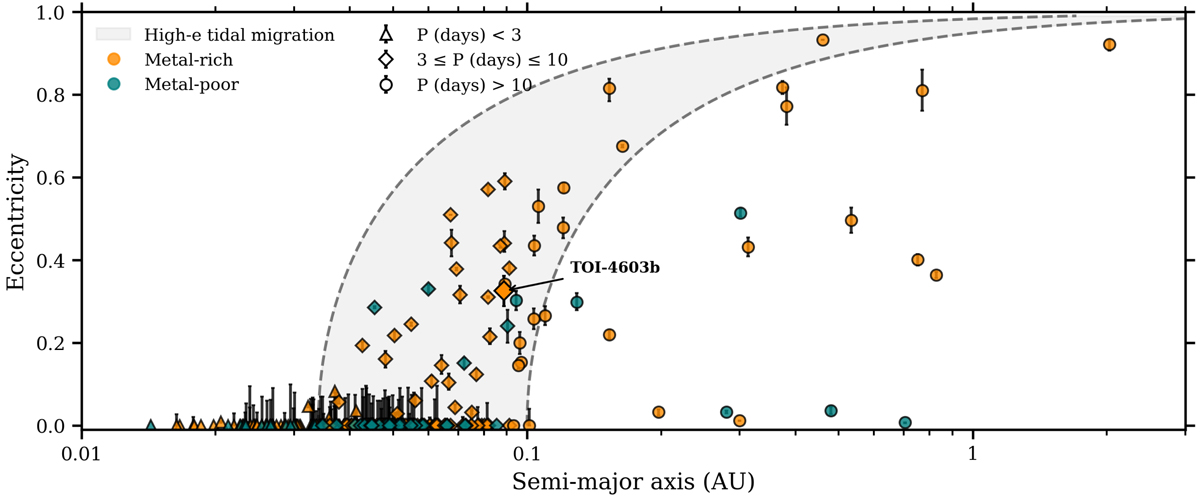
Orbital eccentricities of all the transiting giant planets (0.25MJ < M < 13MJ) plotted with respect to their semimajor axis (a) in AU. The data sets are taken from the TEPcat database (https://www.astro.keele.ac.uk/jkt/tepcat/), and planets whose eccentricities are known to a precision better than 25% are considered. The gray region represents the path of high-eccentricity migration with a range of 0.034–0.1 AU in the final semimajor axis and is set by the Roche limit and the circularization timescale. The giant planets are color-coded according to their host’s metallicity. Triangles represent planets with P < 3 days, diamonds 3 < P < 10 days, and circles P > 10 days. The position of TOI-4603 b is marked with an arrow.
Current usage metrics show cumulative count of Article Views (full-text article views including HTML views, PDF and ePub downloads, according to the available data) and Abstracts Views on Vision4Press platform.
Data correspond to usage on the plateform after 2015. The current usage metrics is available 48-96 hours after online publication and is updated daily on week days.
Initial download of the metrics may take a while.