Open Access
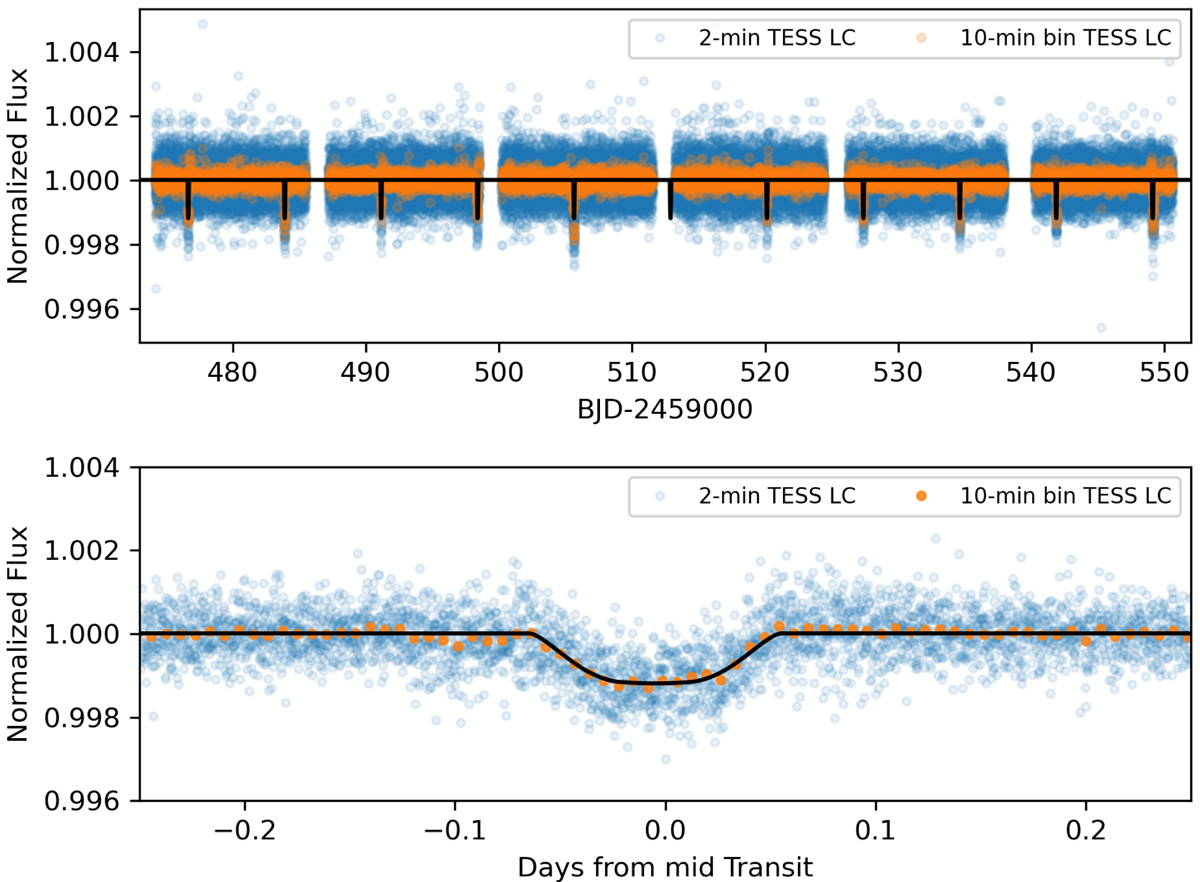
Fig. 1.
Download original image
Normalized PDCSAP light curve for TOI-4603 plotted with respect to time (upper panel) and to time in days from mid-transit (lower panel). The 2-min and 10-min binned data points are represented by blue and orange dots, respectively. The black line represents the best-fit transit model using EXOFASTv2 (see Sect. 3.3).
Current usage metrics show cumulative count of Article Views (full-text article views including HTML views, PDF and ePub downloads, according to the available data) and Abstracts Views on Vision4Press platform.
Data correspond to usage on the plateform after 2015. The current usage metrics is available 48-96 hours after online publication and is updated daily on week days.
Initial download of the metrics may take a while.