Fig. 6
Download original image
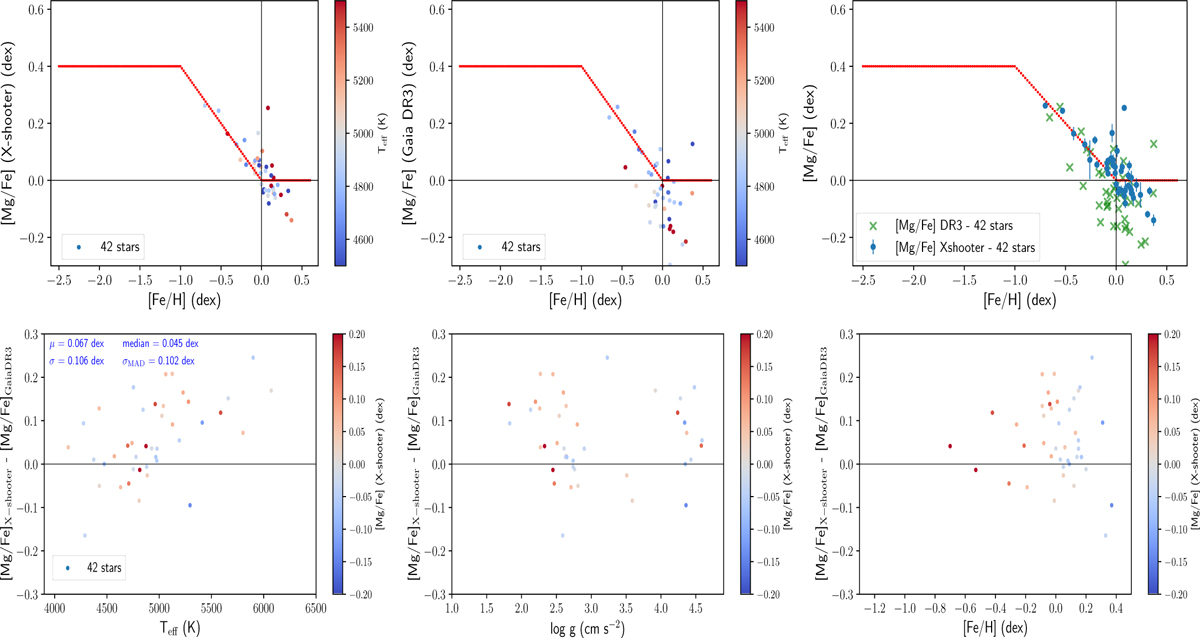
Comparison between derived [Mg/Fe] abundances in this work and those provided from Gaia DR3 data. Top row: abundance ratios [Mg/Fe] vs. [Fe/H] from X-shooter (top-left), Gaia DR3 (top-middle), and both catalogues together (top-right, Gaia DR3 data are represented by green crosses), colour-coded by the stellar effective temperature in the first two panels. The red line is the same as Fig. 5. Bottom row: stellar abundance difference between catalogues as a function of the effective temperature (bottom-left), surface gravity (bottom-middle), and metallicity (bottom-right), colour-coded by the measured [Mg/Fe] abundance. The offset estimates are the same as those described in Fig. 1.
Current usage metrics show cumulative count of Article Views (full-text article views including HTML views, PDF and ePub downloads, according to the available data) and Abstracts Views on Vision4Press platform.
Data correspond to usage on the plateform after 2015. The current usage metrics is available 48-96 hours after online publication and is updated daily on week days.
Initial download of the metrics may take a while.