Fig. 4
Download original image
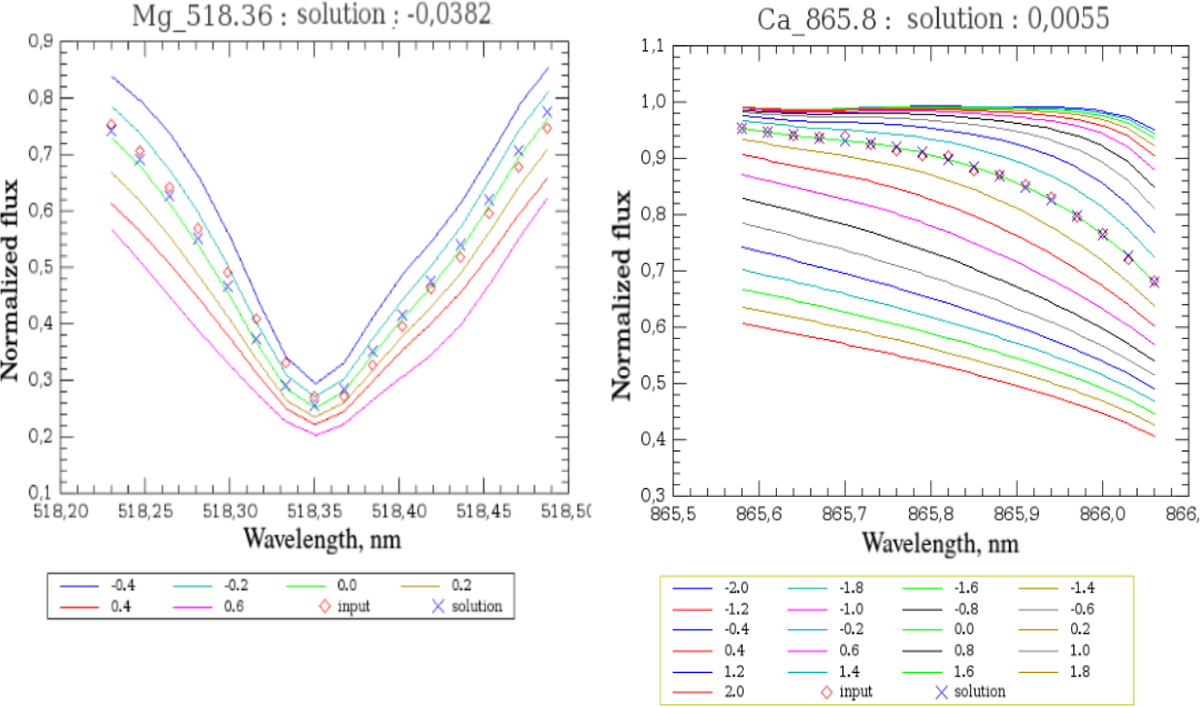
Example of fit carried out by optimisation code GAUGUIN for Mg line 5183.6 Å (left panel) and the left wing of the Ca line 8662.14 Å (right panel) in a solar-type star. The normalised observed spectrum is shown with red open diamonds, while the solution is indicated by blue crosses. The reference synthetic spectra grid is colour-coded according to [α/Fe] (left panel) and [Ca/Fe] values (right panel).
Current usage metrics show cumulative count of Article Views (full-text article views including HTML views, PDF and ePub downloads, according to the available data) and Abstracts Views on Vision4Press platform.
Data correspond to usage on the plateform after 2015. The current usage metrics is available 48-96 hours after online publication and is updated daily on week days.
Initial download of the metrics may take a while.