Fig. 3
Download original image
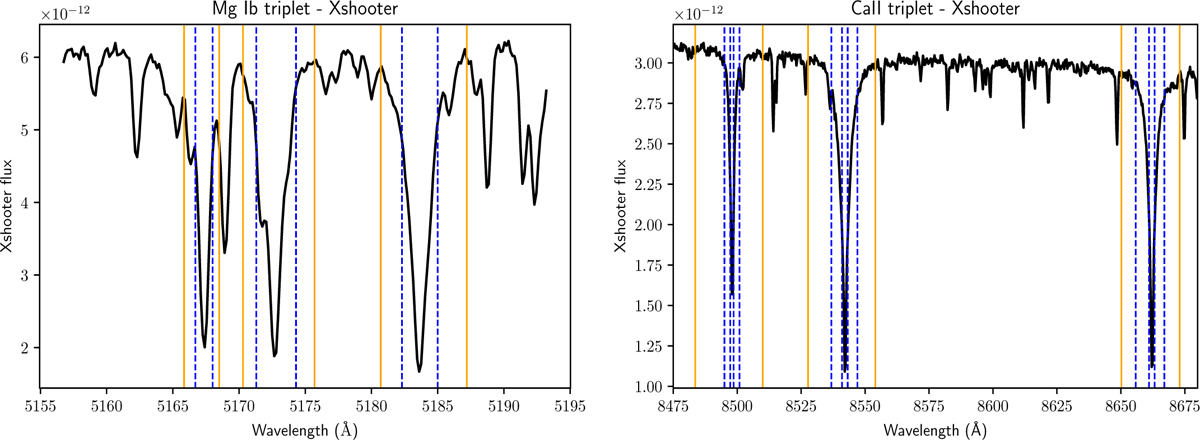
Observed spectrum of a solar-type star from X-shooter spectrograph (R ~ 10 000) around the Mg Ib triplet lines (5167.3, 5172.7 and 5183.6 Å, left panel; S/N ~ 79) and the Ca II IR triplet (8498.02, 8542.09 and 8662.14 Å, right panel; S/N ~ 96). The adopted wavelength domain where the abundance is measured is delimited by blue dashed vertical lines; we note that these intervals exclude the core of the Ca II lines. An example of the adopted local normalisation intervals is shown with an orange vertical line next to each individual line, following the optimised criteria from Santos-Peral et al. (2020).
Current usage metrics show cumulative count of Article Views (full-text article views including HTML views, PDF and ePub downloads, according to the available data) and Abstracts Views on Vision4Press platform.
Data correspond to usage on the plateform after 2015. The current usage metrics is available 48-96 hours after online publication and is updated daily on week days.
Initial download of the metrics may take a while.