Fig. 8.
Download original image
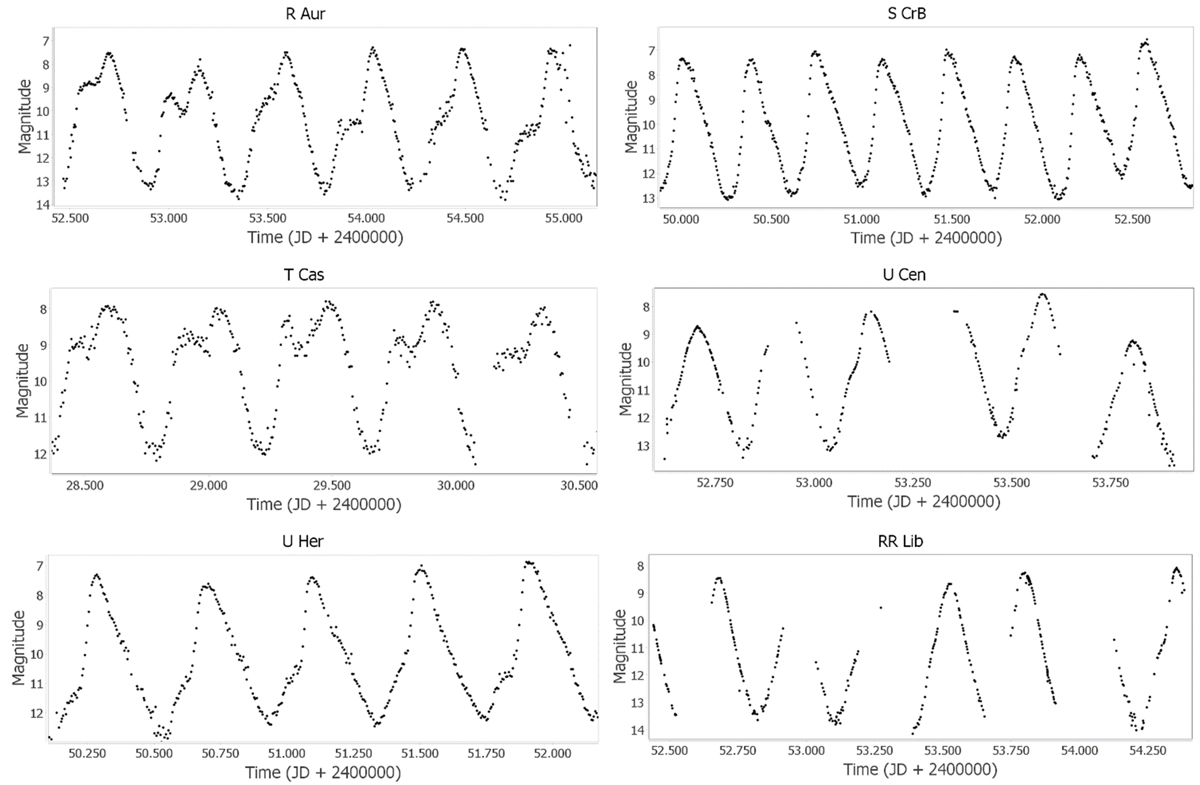
Example light curves of Groups A and S stars. Left column: Group A. From top to bottom: R Aur (bumps in the ascending branch), T Cas (double-peaked maximum), and U Her (abrupt change in the slope of the ascending branch). Right column: Group S. From top to bottom: S CrB (quasi-sinusoidal light curve), U Cen (slight asymmetries only in some of its cycles), and RR Lib (gaps in the light curve prevent us from identifying asymmetries with certainty).
Current usage metrics show cumulative count of Article Views (full-text article views including HTML views, PDF and ePub downloads, according to the available data) and Abstracts Views on Vision4Press platform.
Data correspond to usage on the plateform after 2015. The current usage metrics is available 48-96 hours after online publication and is updated daily on week days.
Initial download of the metrics may take a while.