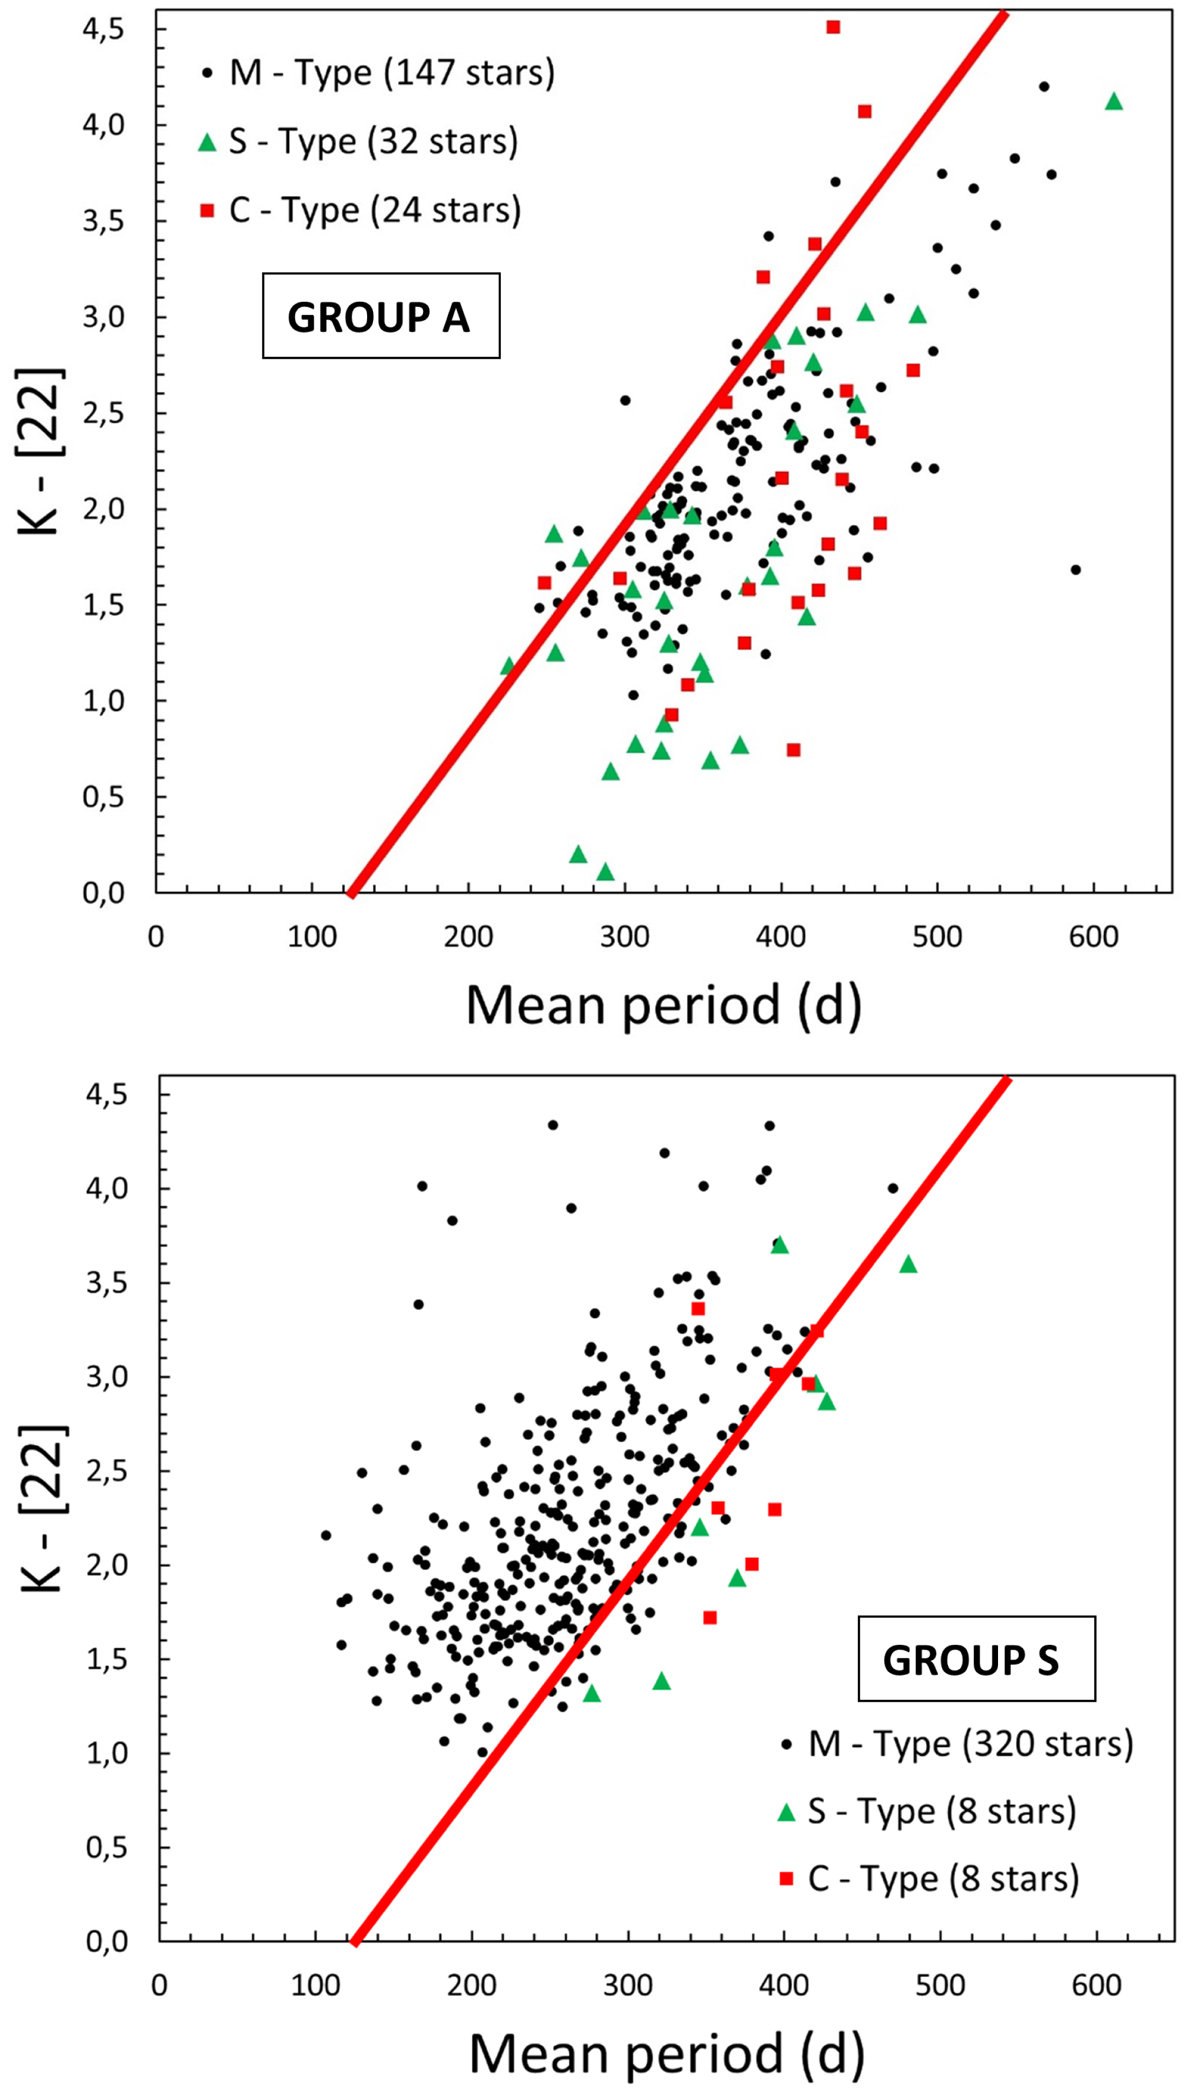
Fig. 13.
Download original image
K − [22] vs. P diagram of Miras. Upper panel: Group A, with bumps or asymmetries in the ascending branch of their light curve. Lower panel: Group S, with symmetric light curves. The symbols distinguish the three main spectral types; see the legend. The solid red line is the linear relation given by Eq. (1). Evidently, Miras without bumps have higher K − [22] colours (dust mass-loss rates) than their siblings with bumps at similar pulsation periods.
Current usage metrics show cumulative count of Article Views (full-text article views including HTML views, PDF and ePub downloads, according to the available data) and Abstracts Views on Vision4Press platform.
Data correspond to usage on the plateform after 2015. The current usage metrics is available 48-96 hours after online publication and is updated daily on week days.
Initial download of the metrics may take a while.