Open Access
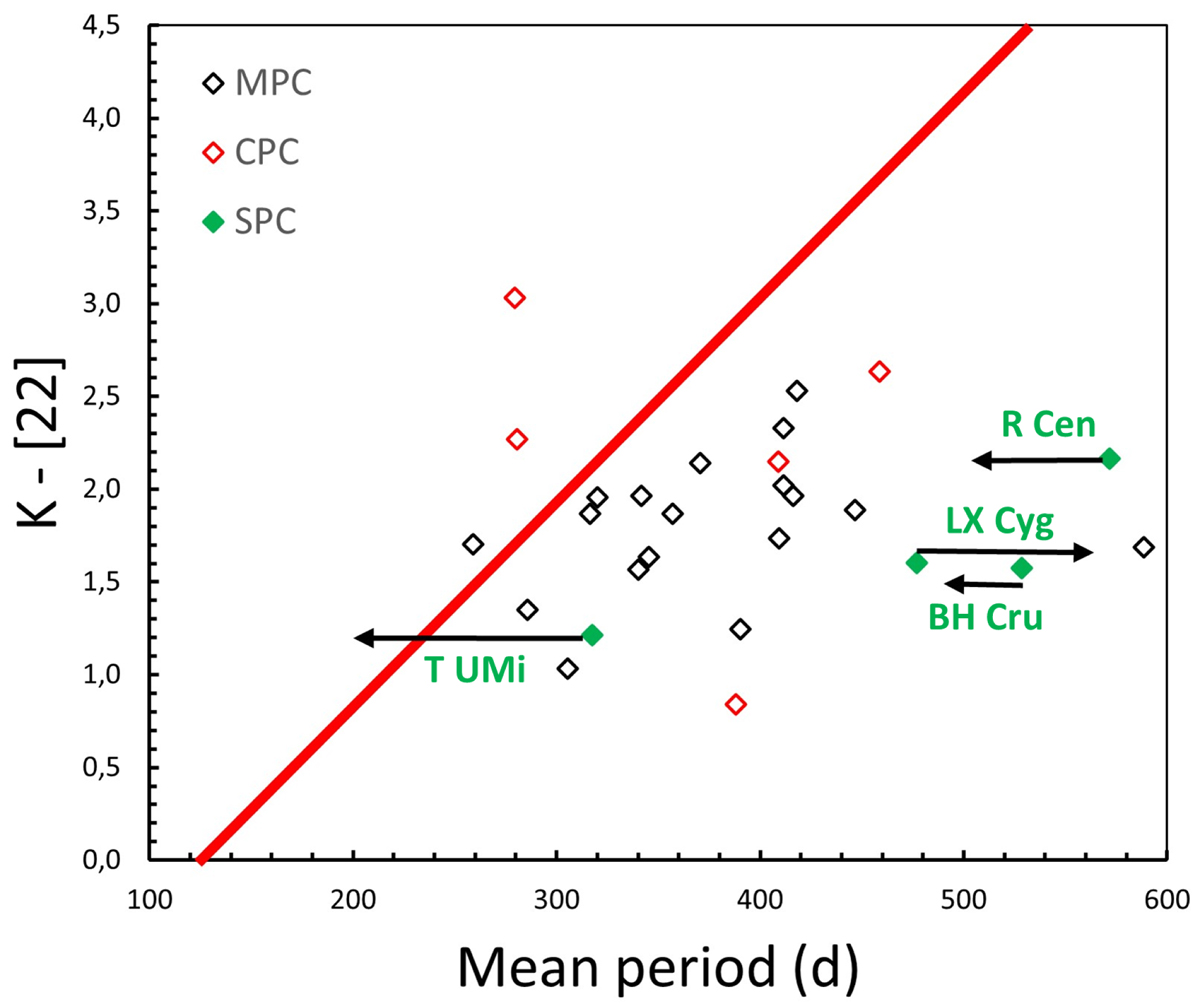
Fig. 11.
Download original image
K − [22] vs. P diagram of the 27 stars in Table 1; see the legend for the identification of the three types of period change. The red solid line is the relation that best separates Tc-poor from Tc-rich Miras following Eq. (1). The arrows attached to the symbols of the SPC stars indicate their recent period evolution.
Current usage metrics show cumulative count of Article Views (full-text article views including HTML views, PDF and ePub downloads, according to the available data) and Abstracts Views on Vision4Press platform.
Data correspond to usage on the plateform after 2015. The current usage metrics is available 48-96 hours after online publication and is updated daily on week days.
Initial download of the metrics may take a while.