Fig. 5
Download original image
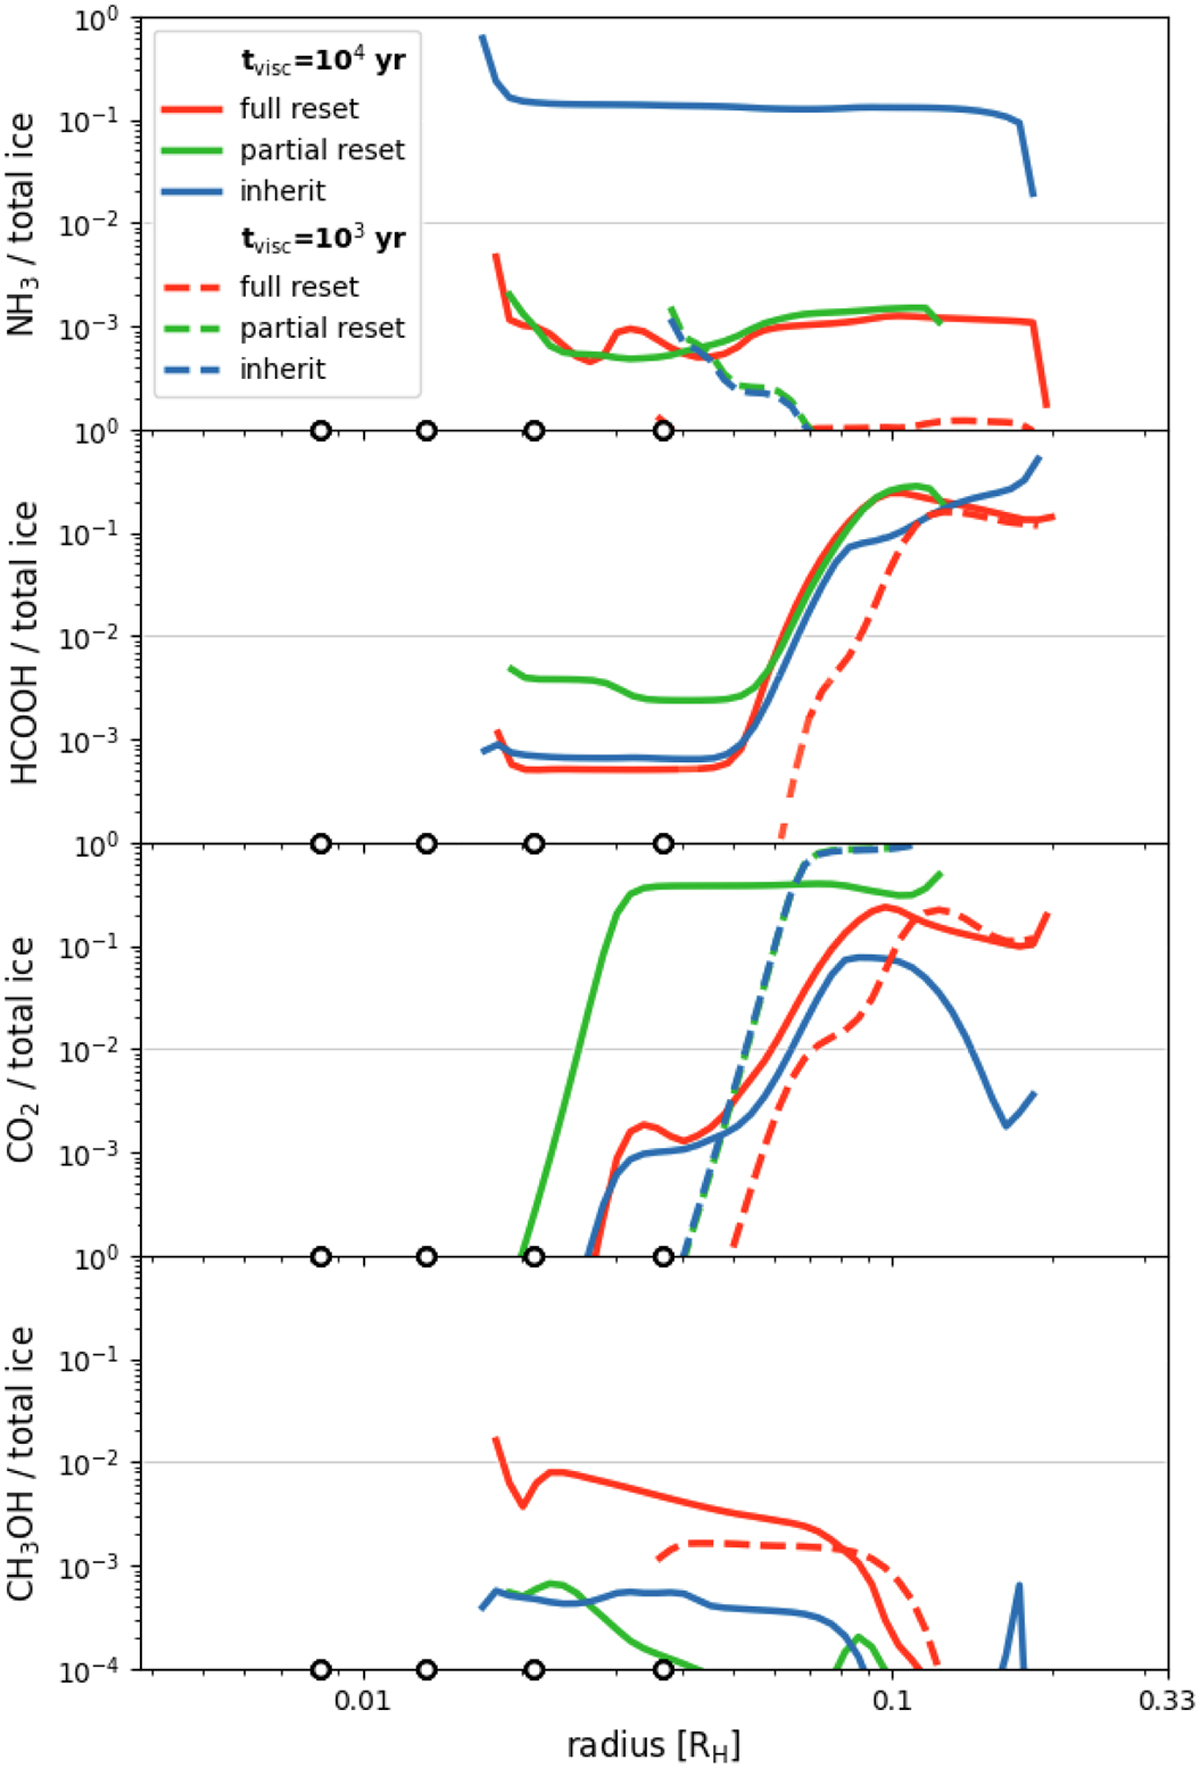
Radial abundance of selected non-H2O ices as a fraction of the total ice abundance for the low-viscosity case with tvisc = 104 yr (solid lines) and high-viscosity case with tvisc = 103 yr (dashed lines). The position of the Galilean satellites are indicated by the empty circles. A light gray horizontal line indicates a concentration of 1%.
Current usage metrics show cumulative count of Article Views (full-text article views including HTML views, PDF and ePub downloads, according to the available data) and Abstracts Views on Vision4Press platform.
Data correspond to usage on the plateform after 2015. The current usage metrics is available 48-96 hours after online publication and is updated daily on week days.
Initial download of the metrics may take a while.