Open Access
Fig. A.1
Download original image
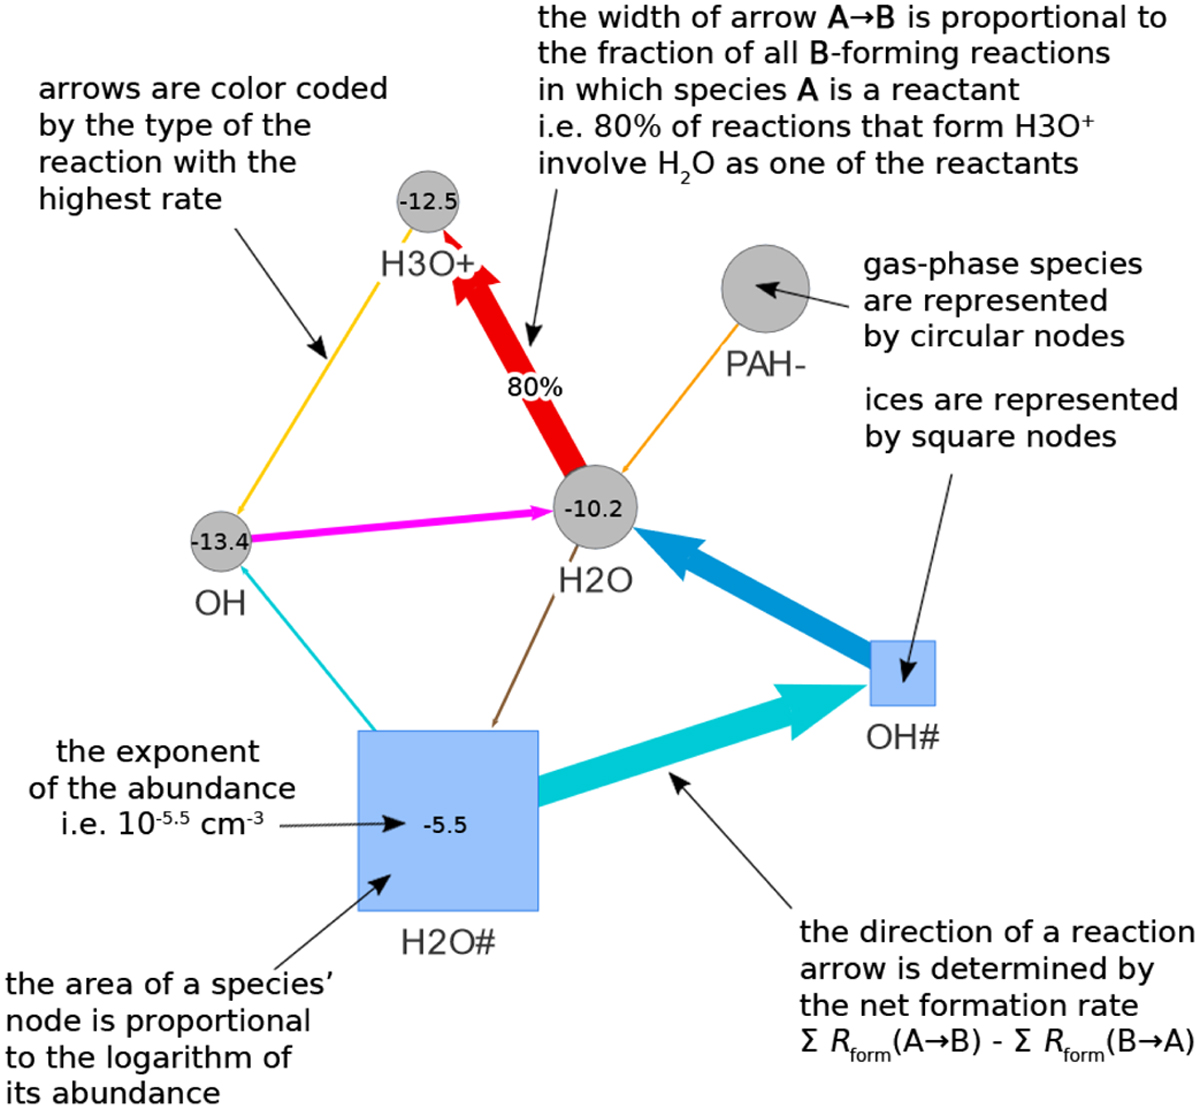
Example chemical network diagram with annotations describing how the diagram can be interpreted. The primary formation pathway of a species may also be highlighted for reference (not depicted).
Current usage metrics show cumulative count of Article Views (full-text article views including HTML views, PDF and ePub downloads, according to the available data) and Abstracts Views on Vision4Press platform.
Data correspond to usage on the plateform after 2015. The current usage metrics is available 48-96 hours after online publication and is updated daily on week days.
Initial download of the metrics may take a while.