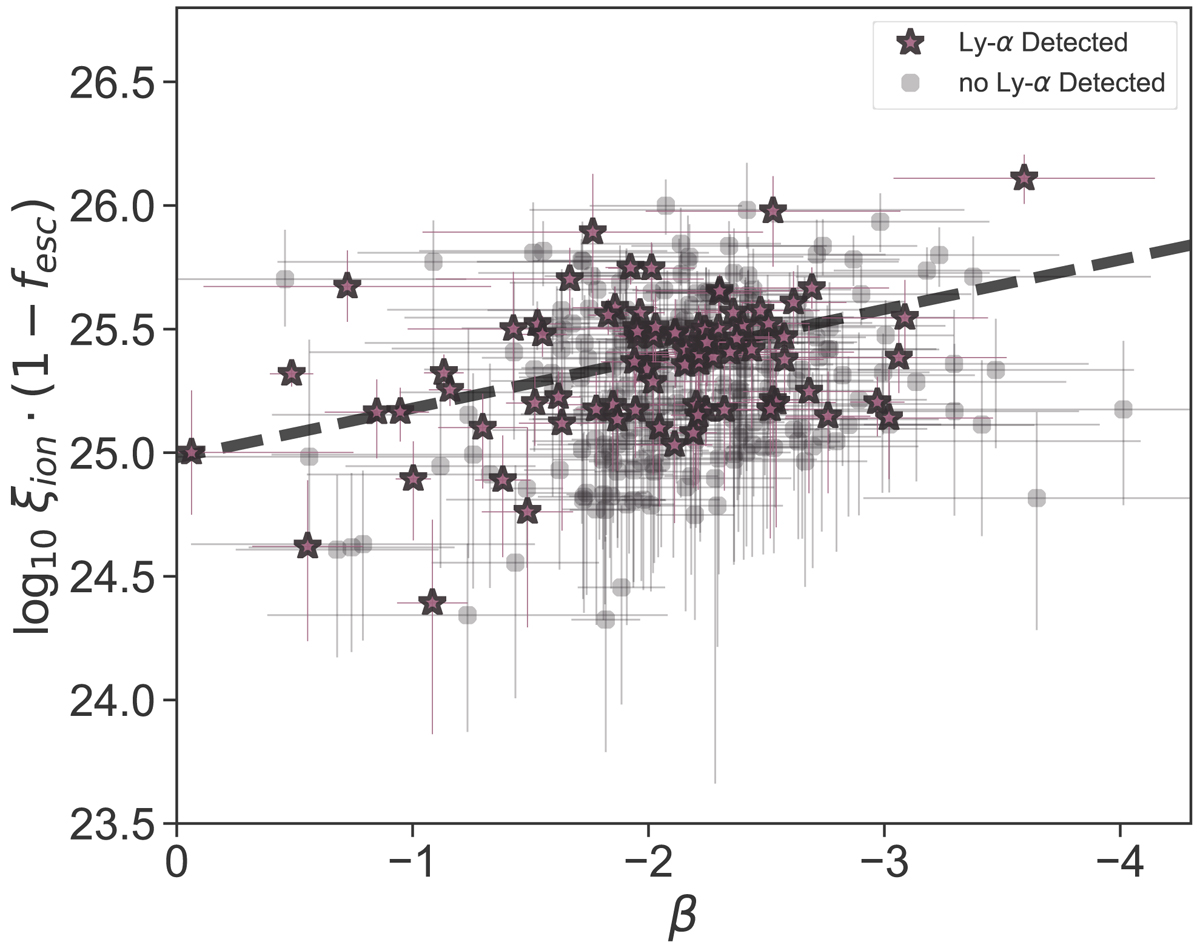
Fig. 5.
Download original image
UV β slope vs. ξion(1 − fesc). Lyα-detected galaxies are shown in purple and the photometrically selected sample with no Lyα-detected in gray. As above, error bars are only shown for 30% of the sources for clarity. We add the stacked measurements from Lam et al. (2019) for comparison. We find a very weak trend of increasing ξion with decreasing β, with a linear slope of −0.10 ± 0.06.
Current usage metrics show cumulative count of Article Views (full-text article views including HTML views, PDF and ePub downloads, according to the available data) and Abstracts Views on Vision4Press platform.
Data correspond to usage on the plateform after 2015. The current usage metrics is available 48-96 hours after online publication and is updated daily on week days.
Initial download of the metrics may take a while.