Fig. 4.
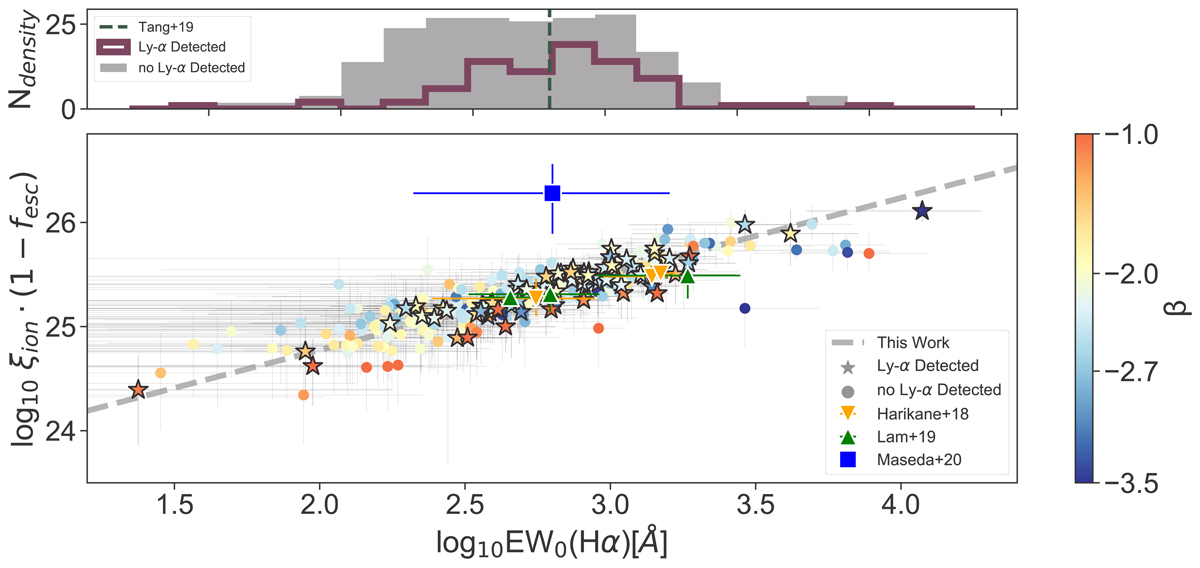
Download original image
Comparison of the Hα EW with the ionizing photon production that does not escape the galaxy. Lyα-detected galaxies are shown as stars and photometrically selected galaxies with no Lyα as circles. As above, error bars are only shown for 30% of the sources for clarity. We color-code these two samples by UV β slope. In the top panel we show the distribution of Hα EWs for the same two samples compared to the values found by Tang et al. (2019). We add data from Harikane et al. (2018) and Lam et al. (2019), which are at the high end of our observed Hα EW distribution, for comparison. We see that a higher ξion correlates very strongly with a higher Hα EW. Galaxies with detected Lyα emission have an Hα EW distribution with higher values, median 732 ± 187 Å compared to 457 ± 161 with a Kolmogorov-Smirnov test p-value ≪0.01. The sources with the reddest UV slopes systematically lie below the best-fit relation at fixed Hα EW.
Current usage metrics show cumulative count of Article Views (full-text article views including HTML views, PDF and ePub downloads, according to the available data) and Abstracts Views on Vision4Press platform.
Data correspond to usage on the plateform after 2015. The current usage metrics is available 48-96 hours after online publication and is updated daily on week days.
Initial download of the metrics may take a while.