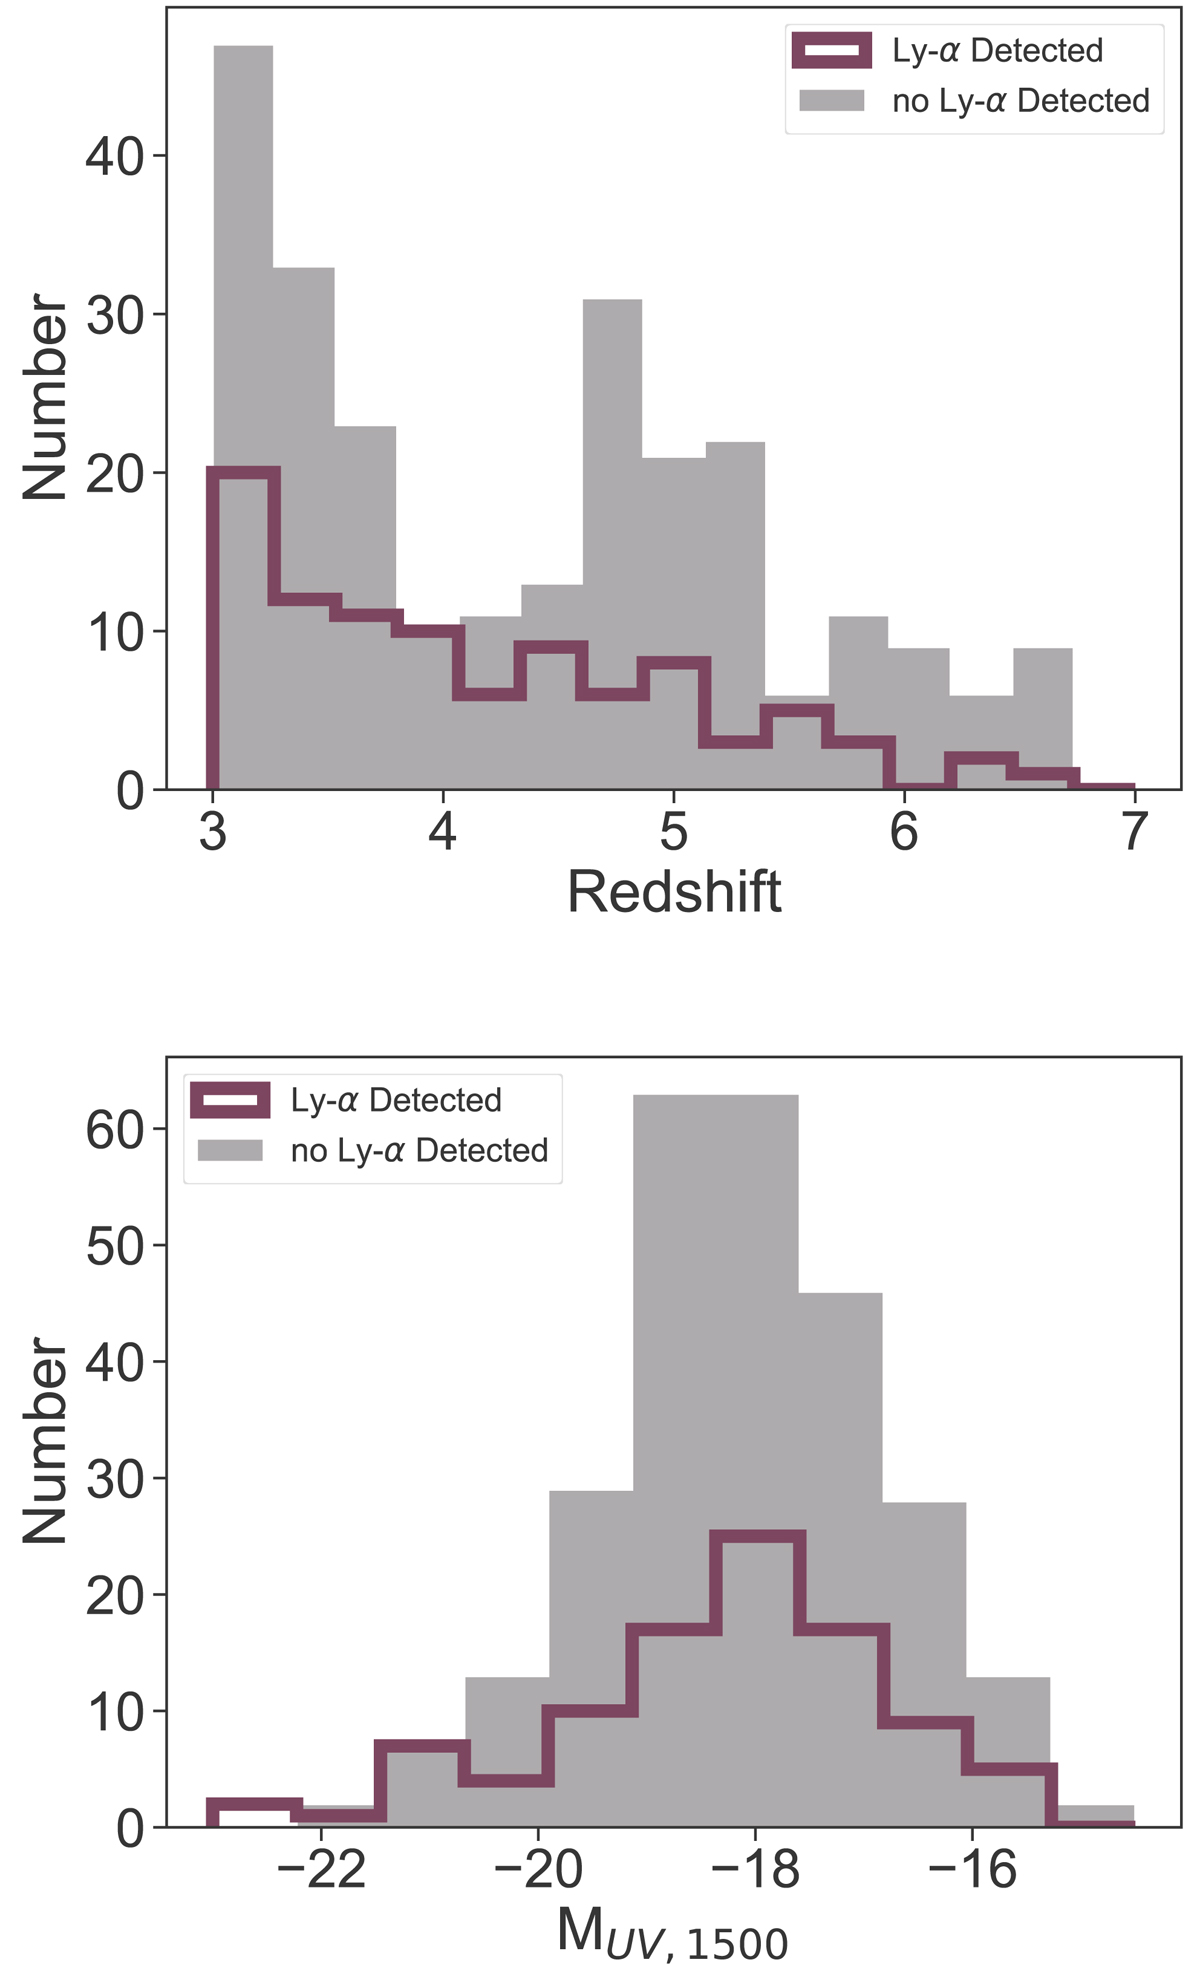
Fig. 1.
Download original image
Galaxies studied in this work: Lyα-detected galaxies (in purple) and galaxies photometrically selected (with no Lyα-detected, in gray). Top: Distribution of redshifts for the spectroscopic and photometric samples. We show the spectroscopic redshift, where available, or the peak photometric redshift. Bottom: UV magnitude distribution for our sample. We find a median value of −18.14 ± 1.58, with no statistically significant difference between the two samples.
Current usage metrics show cumulative count of Article Views (full-text article views including HTML views, PDF and ePub downloads, according to the available data) and Abstracts Views on Vision4Press platform.
Data correspond to usage on the plateform after 2015. The current usage metrics is available 48-96 hours after online publication and is updated daily on week days.
Initial download of the metrics may take a while.