Open Access
Fig. D.1.
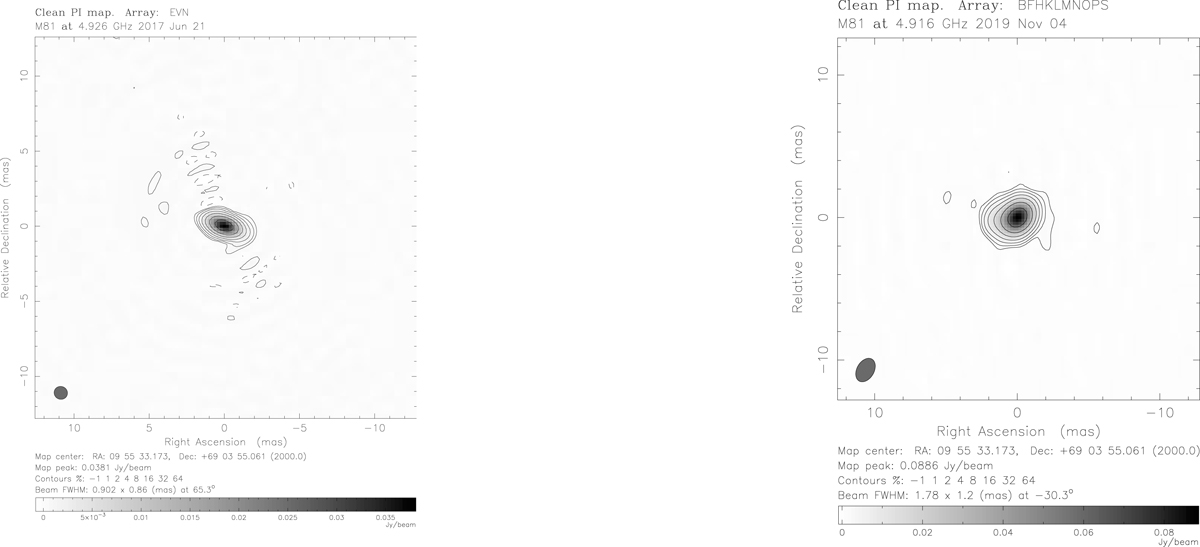
Download original image
Maps of the observations obtained in the C band. The beam size is indicated by the gray ellipse. Panel (a) shows the C-band observation obtained with the EVN in June 2017. Panel (b) shows the C-band observation obtained with the VLBA in November 2019.
Current usage metrics show cumulative count of Article Views (full-text article views including HTML views, PDF and ePub downloads, according to the available data) and Abstracts Views on Vision4Press platform.
Data correspond to usage on the plateform after 2015. The current usage metrics is available 48-96 hours after online publication and is updated daily on week days.
Initial download of the metrics may take a while.