Fig. 3.
Download original image
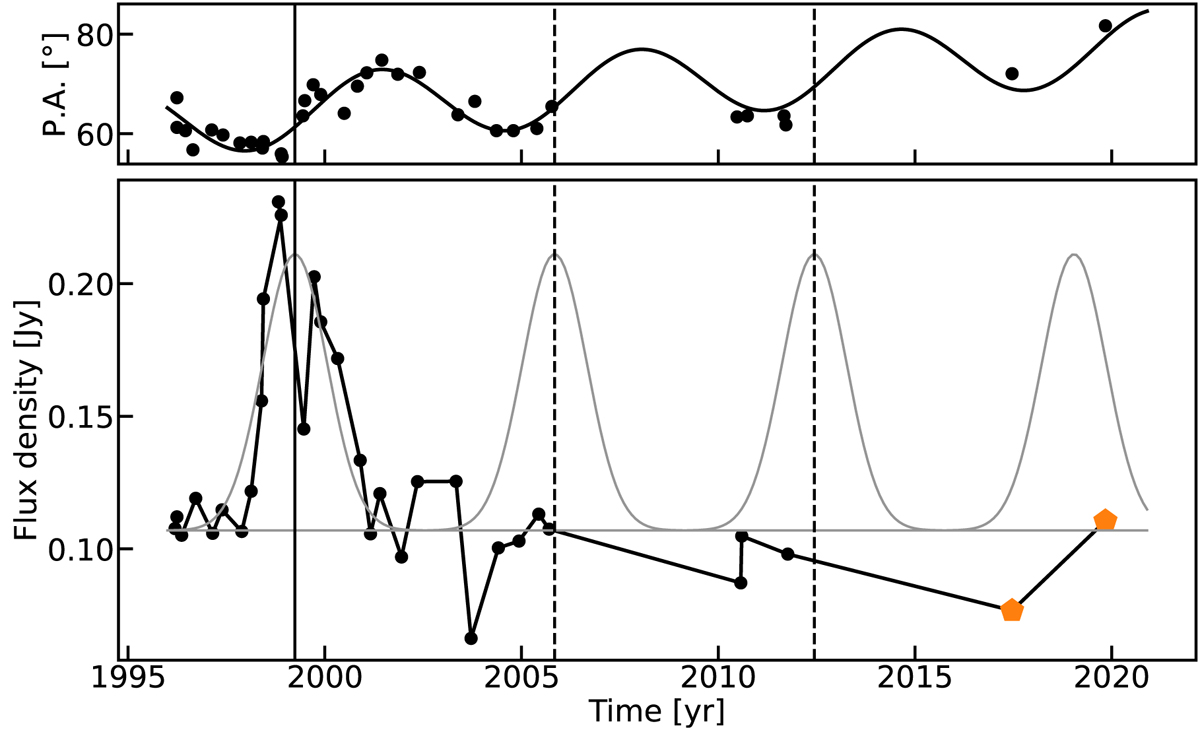
Light curve evolution of M 81*. Top panel: Position angle measurements alongside the best-fit model (Eq. (1)). Lower panel: 5 GHz light curve of M 81*. The black lines indicate the data extracted from Martí-Vidal et al. (2011) and Alberdi et al. (2013), and the orange pentagon denotes our newest measurement. The gray line shows a best-fit Gaussian model, which approximates the observed flare. The vertical line indicates the peak of the Gaussian flare model. The Gaussian flare shape is shifted by the precession period (6.9 yr).
Current usage metrics show cumulative count of Article Views (full-text article views including HTML views, PDF and ePub downloads, according to the available data) and Abstracts Views on Vision4Press platform.
Data correspond to usage on the plateform after 2015. The current usage metrics is available 48-96 hours after online publication and is updated daily on week days.
Initial download of the metrics may take a while.