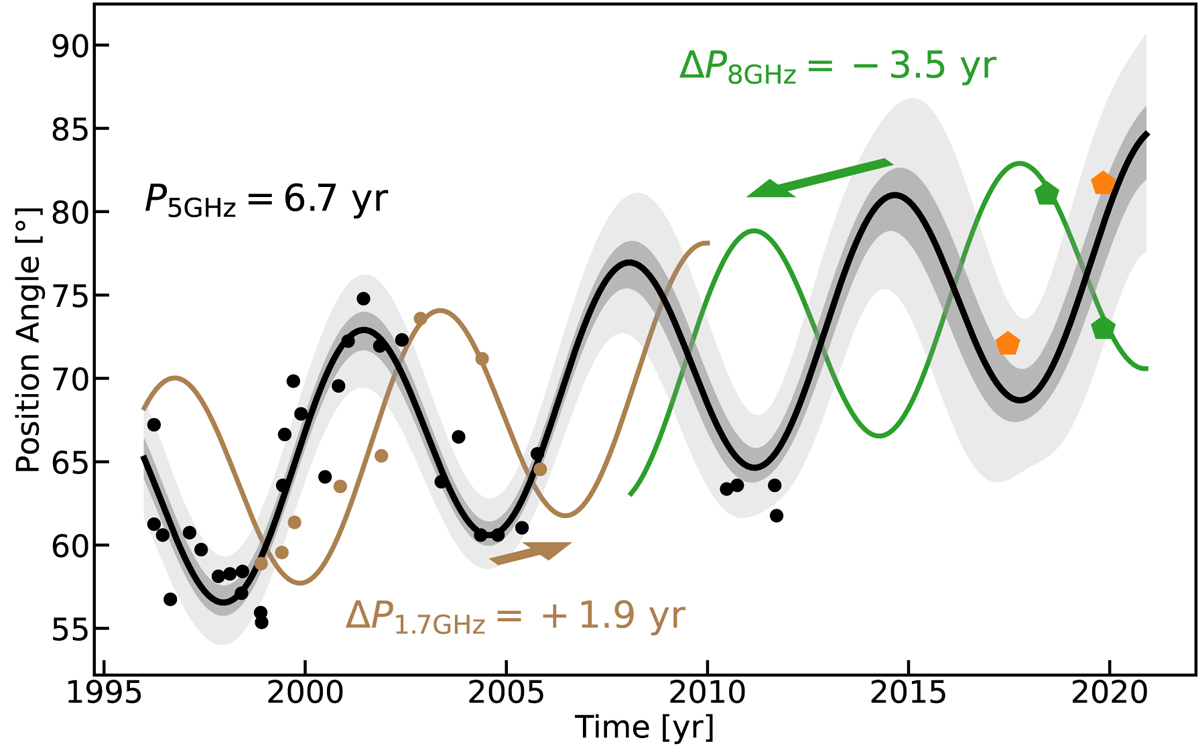
Fig. 2.
Download original image
Multifrequency data of the core position angle of M 81*. The black points indicate the 5 GHz position angle as presented by Martí-Vidal et al. (2011), and the orange pentagons show the new 2018 and 2019 measurements. The black line with gray contours (1σ, 2σ, and 3σ) shows the best fit to all 5 GHz data. The brown points show the 1.7 GHz data; the brown line shows the best fit to the 5 GHz data, shifted by 1.9 yr, as suggested by Martí-Vidal et al. (2011). The green points show the 8 GHz measurement; the green line shows the best-fit 5GHz model shifted by ∼ − 3.5 yr.
Current usage metrics show cumulative count of Article Views (full-text article views including HTML views, PDF and ePub downloads, according to the available data) and Abstracts Views on Vision4Press platform.
Data correspond to usage on the plateform after 2015. The current usage metrics is available 48-96 hours after online publication and is updated daily on week days.
Initial download of the metrics may take a while.