Fig. 1.
Download original image
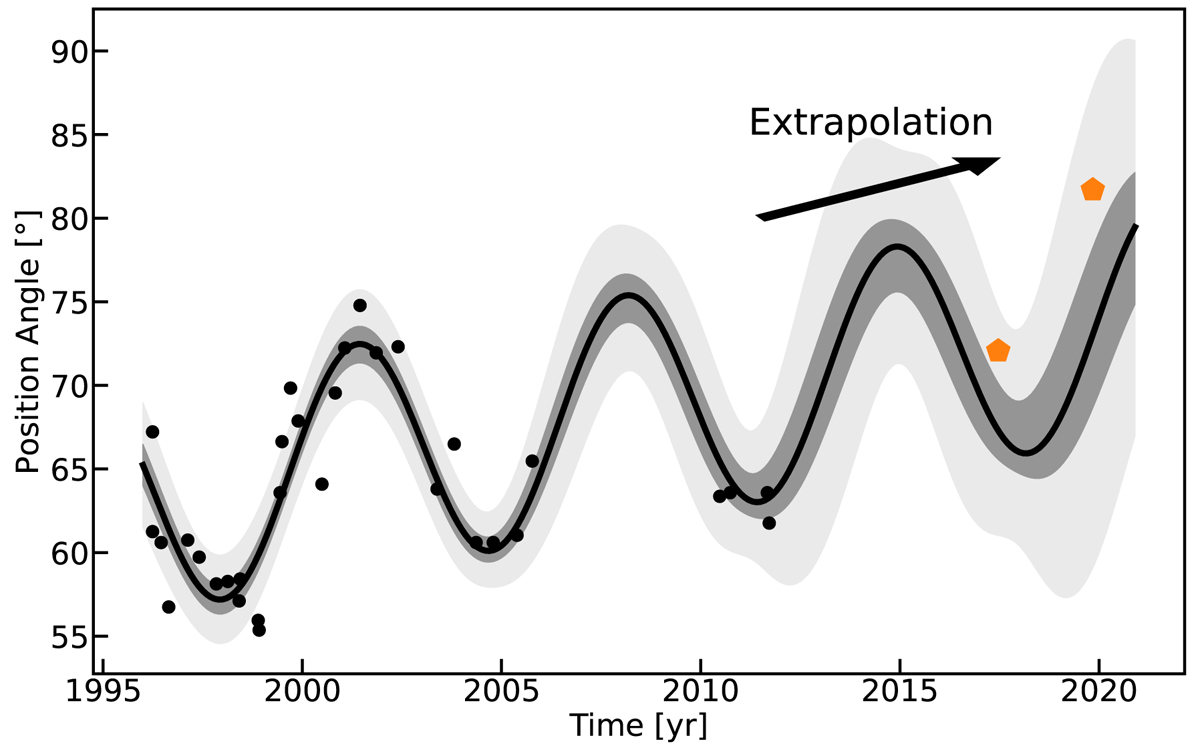
Comparison of the recent observation with the model extrapolation. Black dots show the position angle measurement as a function of time up to the year 2012. The orange pentagons show the 5 GHz data derived in this work. The black line shows the best-fit model to the data up to 2012 by Alberdi et al. (2013), excluding the new measurements, and extrapolated to the year 2021. The gray shaded region indicates the 1σ and 3σ contours.
Current usage metrics show cumulative count of Article Views (full-text article views including HTML views, PDF and ePub downloads, according to the available data) and Abstracts Views on Vision4Press platform.
Data correspond to usage on the plateform after 2015. The current usage metrics is available 48-96 hours after online publication and is updated daily on week days.
Initial download of the metrics may take a while.