Fig. 9.

Download original image
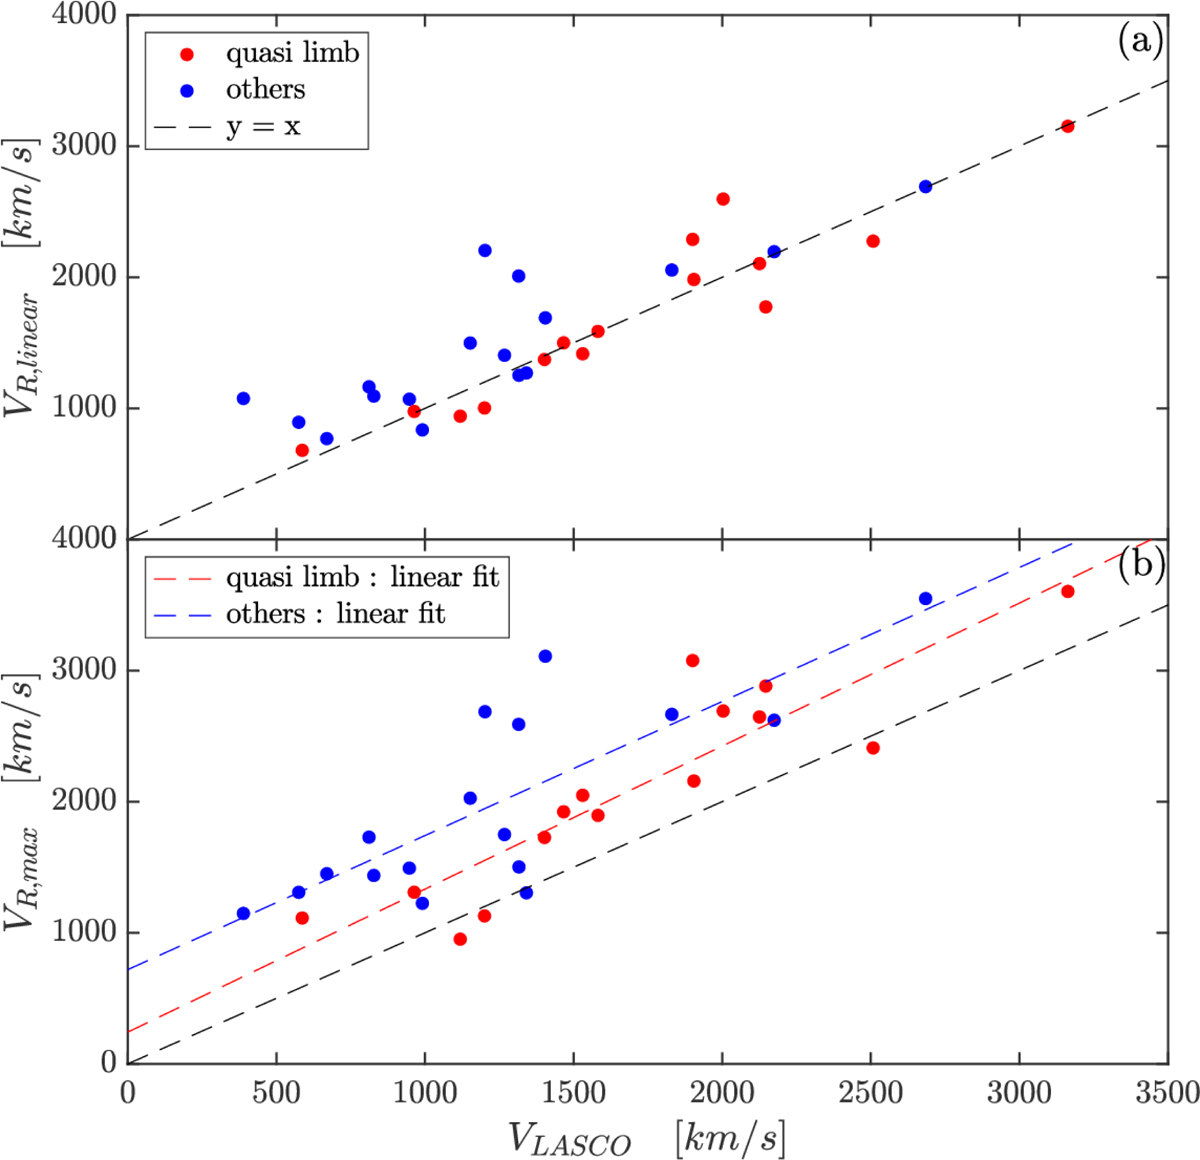
Projection effects as a function of VLASCO, which is the linear CME speed from SoHO/LASCO CME catalogue. Panel a: VR, linear, the radial speed calculated from the derivation of the linear fit of position XR (yellow line in Fig. 8). Red points correspond to events close to the limb, which are events at a longitude of ∈[45, 135] ∪ [−45, −135] in the Stonyhurst coordinate system. The blue points correspond to the others, with a longitude ∈[−45, 45] ∪ [−135, −180] ∪ [135, 180], directed towards or inwards the Earth, respectively. Panel b: VR, max with the same colour code. The red dashed line is a linear fit of the red points, corresponding to Eq. (3) with a CC of 0.89, and the blue dashed line is a linear fit of the blue points, corresponding to Eq. (4) with a CC of 0.78.
Current usage metrics show cumulative count of Article Views (full-text article views including HTML views, PDF and ePub downloads, according to the available data) and Abstracts Views on Vision4Press platform.
Data correspond to usage on the plateform after 2015. The current usage metrics is available 48-96 hours after online publication and is updated daily on week days.
Initial download of the metrics may take a while.


