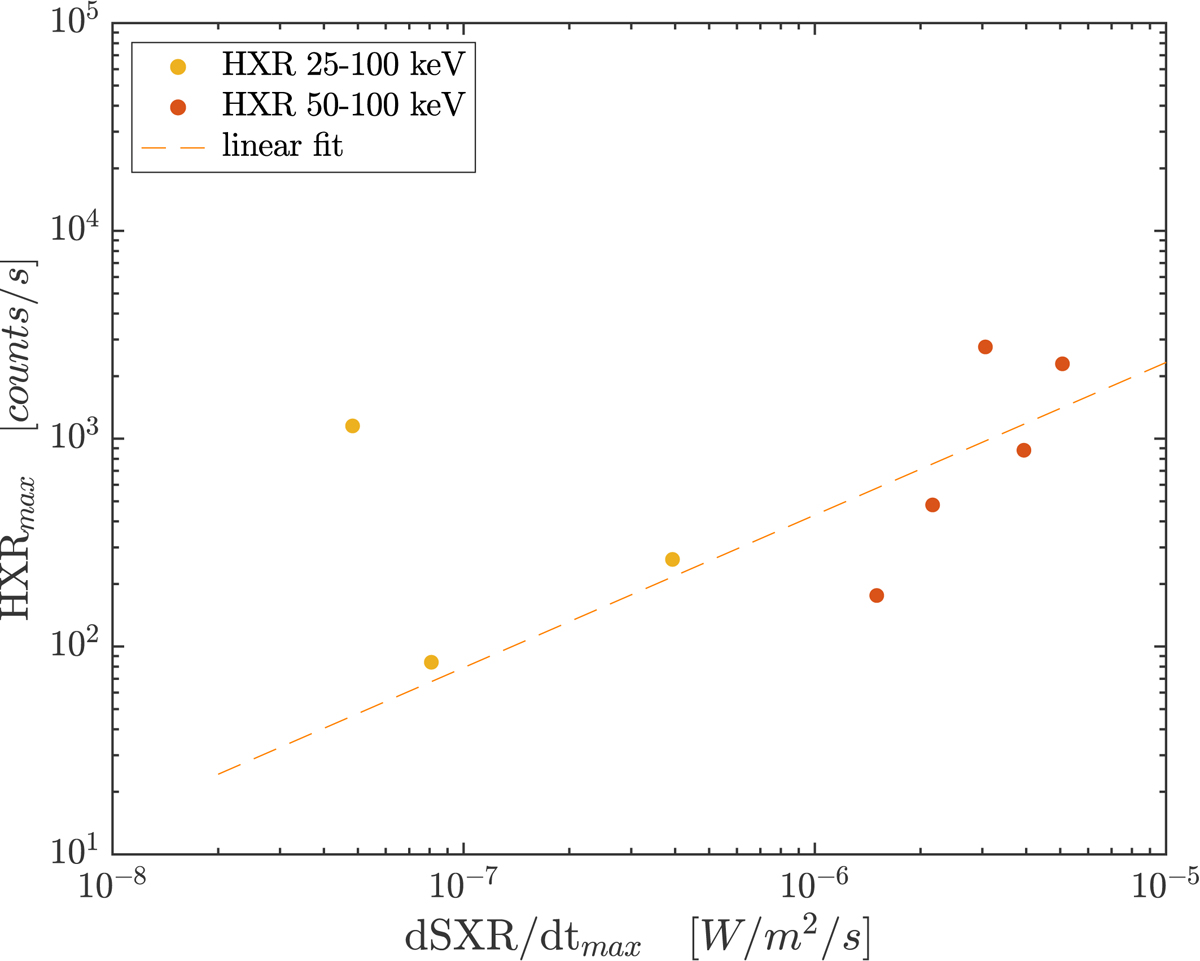
Fig. 11.

Download original image
Peak of the HXR emission as a function of the peak of the soft X-ray derivative (dSXR/dt) flux for the height CMEs events with an associated hard X-ray flare. Yellow points are associated with HXR in the energy band 25−100 keV and red points to HXR in the energy band 50−100 keV because they are X-class GOES SXR. The orange dashed line represents the best fit for the data where we excluded the extreme yellow point with high HXRmax and low dSXR/dtmax. The corresponding Eq. (5) have a CC of 0.80.
Current usage metrics show cumulative count of Article Views (full-text article views including HTML views, PDF and ePub downloads, according to the available data) and Abstracts Views on Vision4Press platform.
Data correspond to usage on the plateform after 2015. The current usage metrics is available 48-96 hours after online publication and is updated daily on week days.
Initial download of the metrics may take a while.


