Fig. 8
Download original image
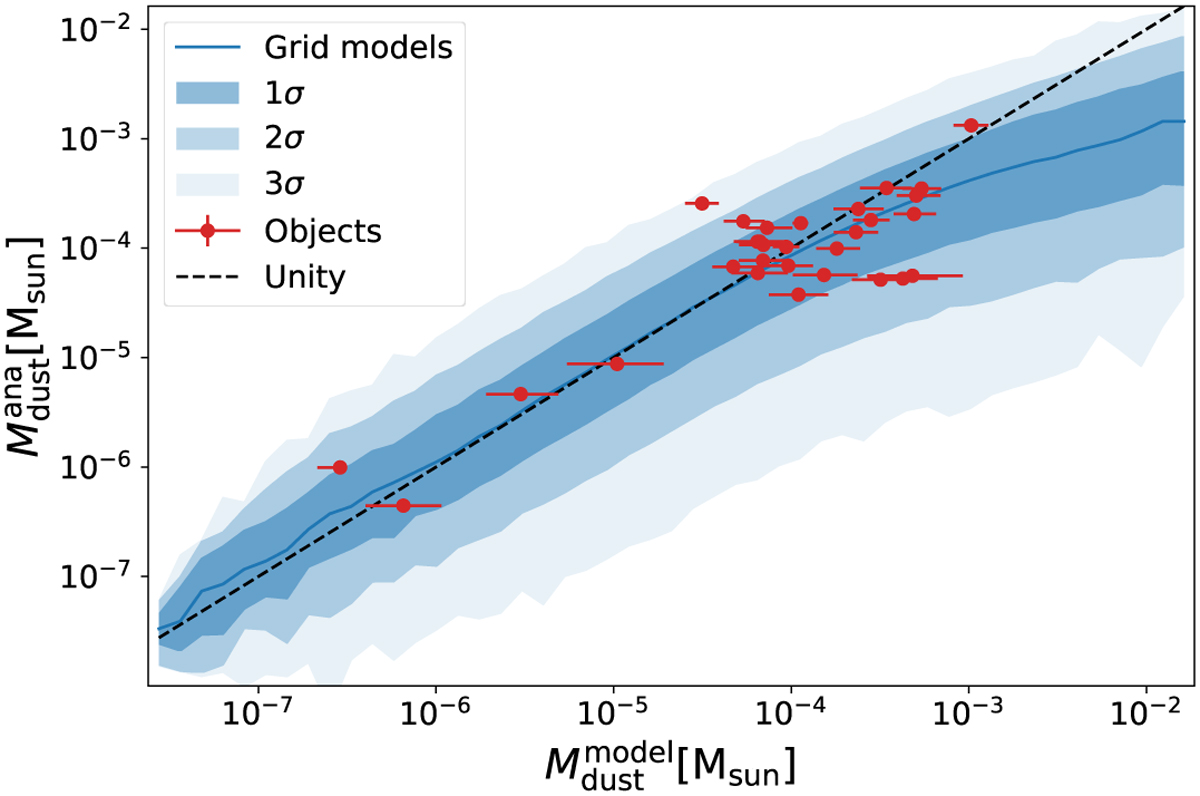
Calculated dust mass with Eq. (6) using the flux at 850 µm, ![]() , and
, and ![]() K in comparison with the model dust mass. The blue distribution shows all single and two-zone models that were used to train and test the NNs. The distribution is derived by dividing the value range of
K in comparison with the model dust mass. The blue distribution shows all single and two-zone models that were used to train and test the NNs. The distribution is derived by dividing the value range of ![]() into 50 equal size bins in log space. The coloured lines show the median value for all models within their respective bins, the strongly, medium, and lightly shaded areas display the 1σ-, 2σ, and 3σ percentiles of each bin. Over plotted are the object fits from Sect. 3.3. The model values denote the result of the posterior distribution, with the error bars representing the 1 (contour. The analytical dust masses are calculated in the same way as done for all grid models, with the fluxes at 850 µm of the respective models.
into 50 equal size bins in log space. The coloured lines show the median value for all models within their respective bins, the strongly, medium, and lightly shaded areas display the 1σ-, 2σ, and 3σ percentiles of each bin. Over plotted are the object fits from Sect. 3.3. The model values denote the result of the posterior distribution, with the error bars representing the 1 (contour. The analytical dust masses are calculated in the same way as done for all grid models, with the fluxes at 850 µm of the respective models.
Current usage metrics show cumulative count of Article Views (full-text article views including HTML views, PDF and ePub downloads, according to the available data) and Abstracts Views on Vision4Press platform.
Data correspond to usage on the plateform after 2015. The current usage metrics is available 48-96 hours after online publication and is updated daily on week days.
Initial download of the metrics may take a while.