Fig. D.4
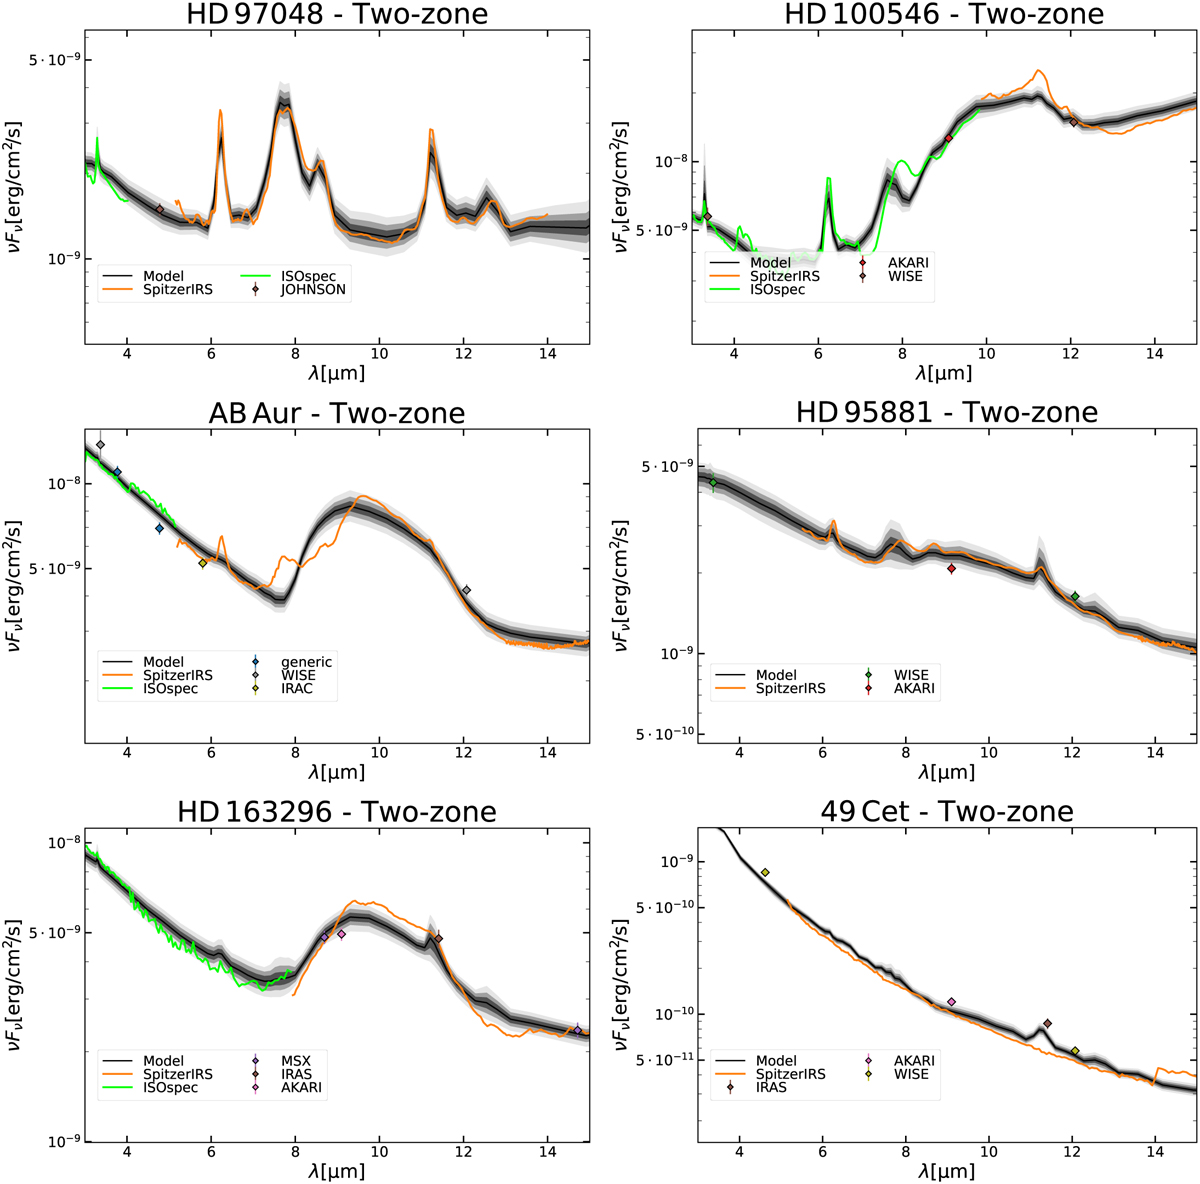
Download original image
Mid-IR region of the SED for all objects. The coloured points and lines indicate the observation listed in the legend. The SEDs from the posterior distribution are shown in black. The line denotes the median of all model SED, with the dark, medium, and light black areas denoting the 68%, 95%, and 99.9% percentiles, respectively. The name of the model and if it is fitted with a single or two-zone model is given in the title.
Current usage metrics show cumulative count of Article Views (full-text article views including HTML views, PDF and ePub downloads, according to the available data) and Abstracts Views on Vision4Press platform.
Data correspond to usage on the plateform after 2015. The current usage metrics is available 48-96 hours after online publication and is updated daily on week days.
Initial download of the metrics may take a while.