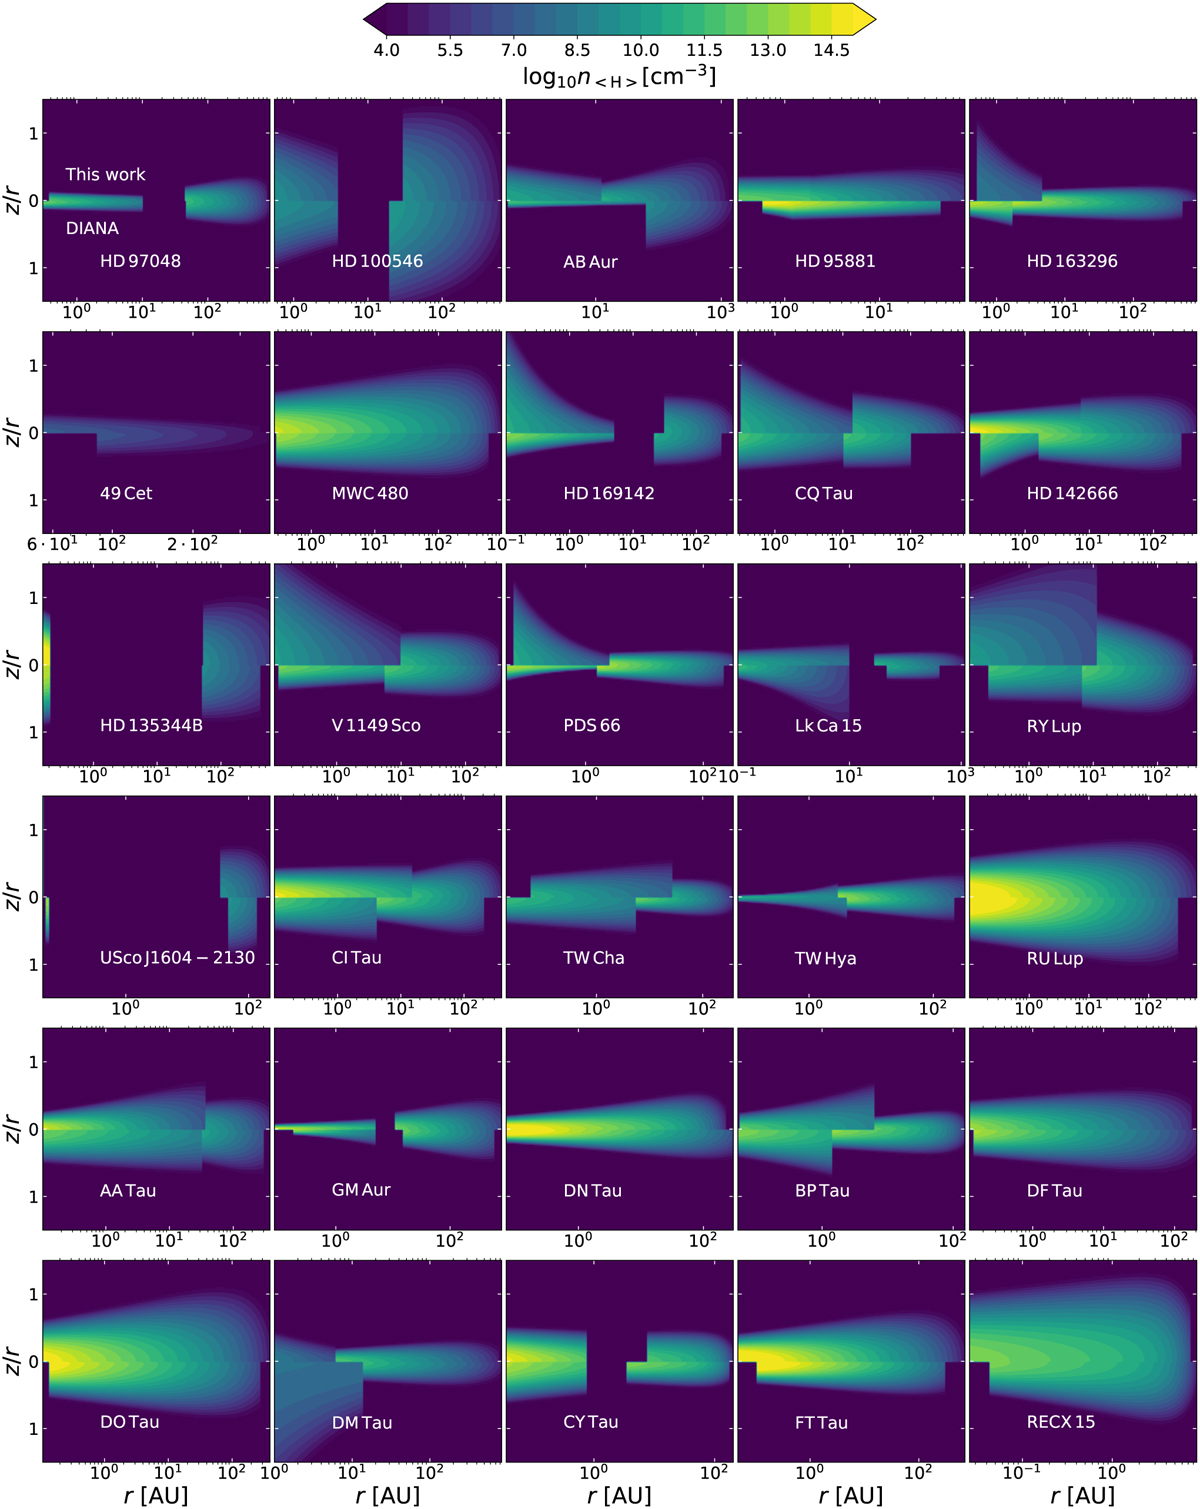
Fig. D.1
Download original image
Density plots for every object’s median probable model to reproduce the DIANA results (Sect. 3.2). Every panel shows the density structure in number densities of Hydrogen per cubic centimetre (colour bar at the top) for the objects noted in the panel. The upper and lower half of every plot depict the model from this study and DIANA, respectively. The radial axis is different for every object. The inner zones of Usco J1604-2130 in this work has a radial extent smaller than the radial resolution of the plots.
Current usage metrics show cumulative count of Article Views (full-text article views including HTML views, PDF and ePub downloads, according to the available data) and Abstracts Views on Vision4Press platform.
Data correspond to usage on the plateform after 2015. The current usage metrics is available 48-96 hours after online publication and is updated daily on week days.
Initial download of the metrics may take a while.