Fig. B.3
Download original image
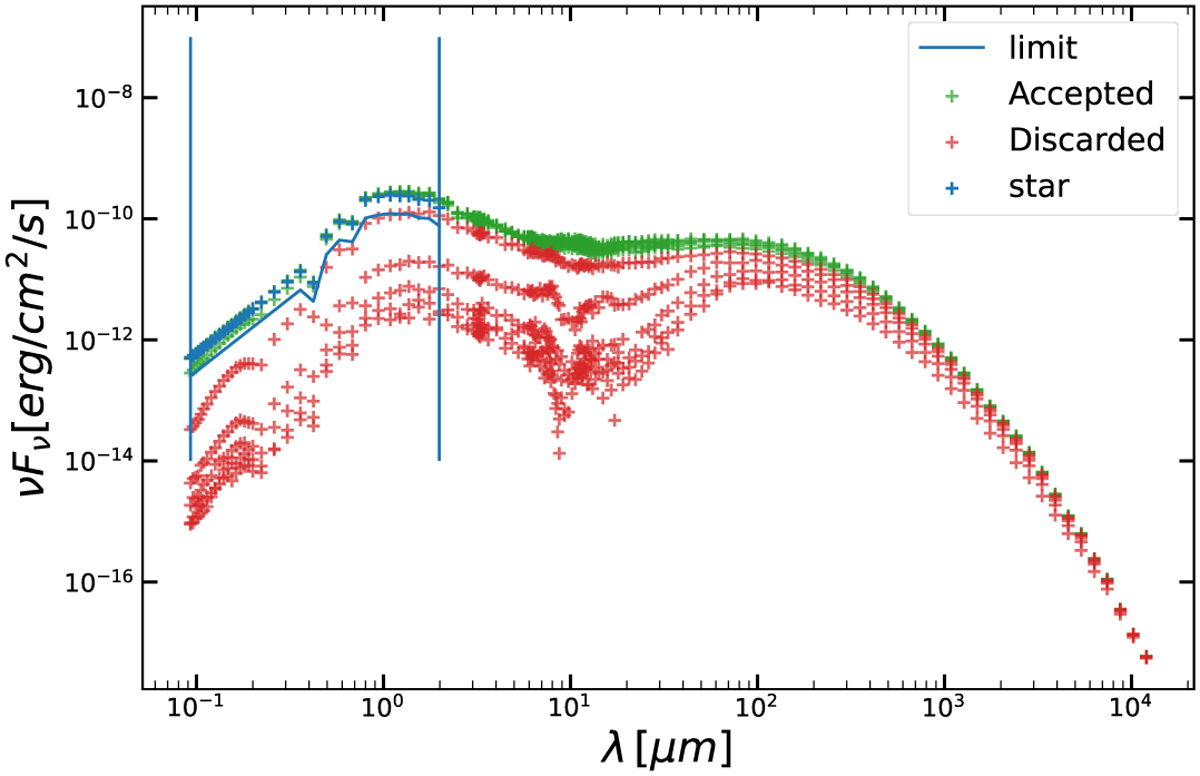
Example of an MCFOST model with SEDs for all 10 different inclinations. The blue points show the stellar flux at different wavelengths between 0.1 µm and 2 µm (both shown as vertical blue lines). The blue line encode the limit, which is used to distinguish non- shielded inclinations (green SEDs) that were accepted for the sample and shielded inclinations (red SEDs) that were discarded.
Current usage metrics show cumulative count of Article Views (full-text article views including HTML views, PDF and ePub downloads, according to the available data) and Abstracts Views on Vision4Press platform.
Data correspond to usage on the plateform after 2015. The current usage metrics is available 48-96 hours after online publication and is updated daily on week days.
Initial download of the metrics may take a while.