Fig. B.1
Download original image
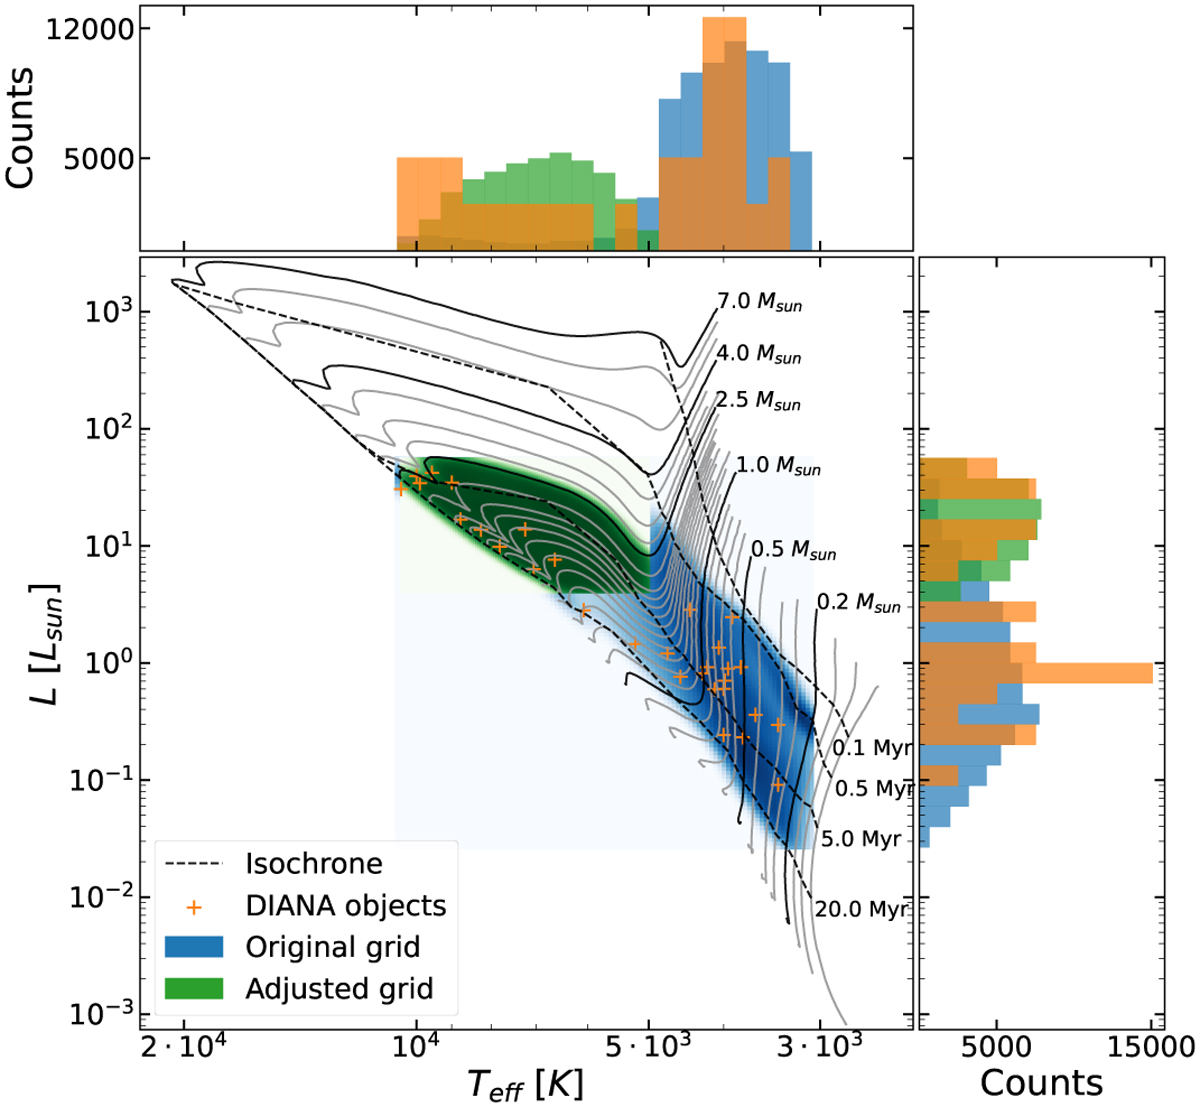
Hertzsprung-Russell diagram of the DIANA sample (orange markers) and all stars in the original single zone grid (blue) and the adjusted grid (green). The grey lines are the evolutionary tracks from (Siess et al. 2000) for different masses, and the coloured dashed lines are isochrones. The histograms show the distribution of values for luminosity and temperature for the sample and the grid in the same colours as used in the main plot. The sample's histogram is scaled to make a comparison easier.
Current usage metrics show cumulative count of Article Views (full-text article views including HTML views, PDF and ePub downloads, according to the available data) and Abstracts Views on Vision4Press platform.
Data correspond to usage on the plateform after 2015. The current usage metrics is available 48-96 hours after online publication and is updated daily on week days.
Initial download of the metrics may take a while.