Fig. A.1
Download original image
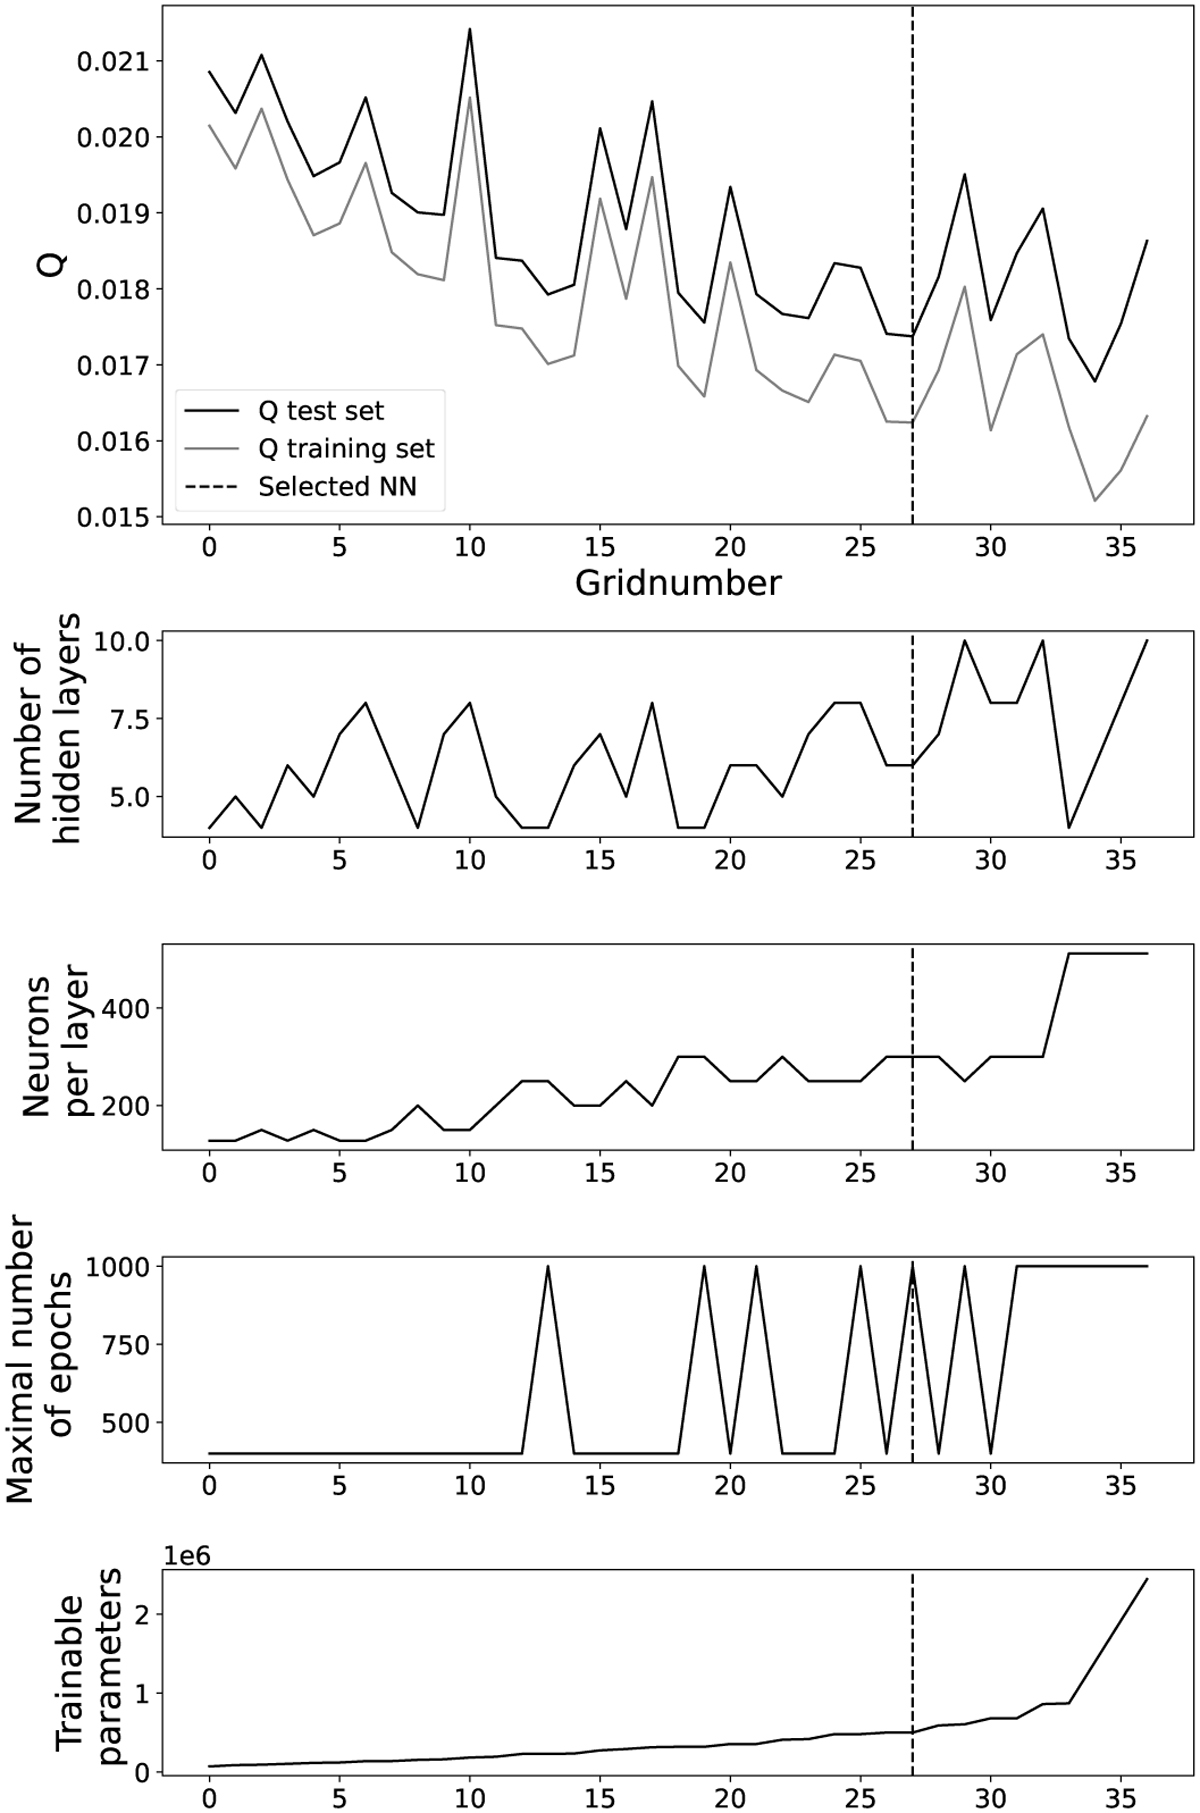
Hypergrid to determine the best architecture of single zone NNs. The upper panel displays the quality Q of the test and training set for 37 different NNs as explained in Eq. A.1. The number of layers, neurons per layer, and the maximum number of epochs trained for every NN are shown in the lower panels. The lowest panel displays the number of trainable parameters in the NNs. The dashed line denotes the selected NN.
Current usage metrics show cumulative count of Article Views (full-text article views including HTML views, PDF and ePub downloads, according to the available data) and Abstracts Views on Vision4Press platform.
Data correspond to usage on the plateform after 2015. The current usage metrics is available 48-96 hours after online publication and is updated daily on week days.
Initial download of the metrics may take a while.