Fig. 12
Download original image
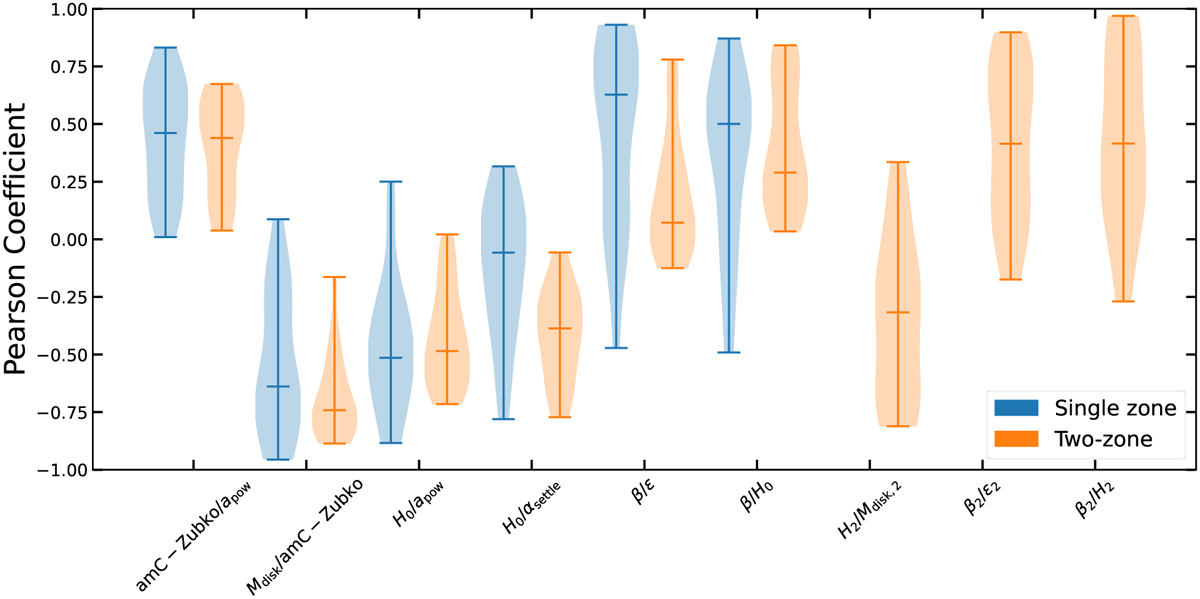
Pearson correlation coefficients for selected combinations of model parameters. Values close to +1 and -1 denote strong positive and negative correlations, respectively, whereas 0 means no correlation. Every violin depicts the distribution of correlation coefficients for all single (blue) and two-zone (orange) models (Sect. 3.3). The upper, middle, and lower bars show the maximal, median, and minimal value, respectively.
Current usage metrics show cumulative count of Article Views (full-text article views including HTML views, PDF and ePub downloads, according to the available data) and Abstracts Views on Vision4Press platform.
Data correspond to usage on the plateform after 2015. The current usage metrics is available 48-96 hours after online publication and is updated daily on week days.
Initial download of the metrics may take a while.