Fig. 11
Download original image
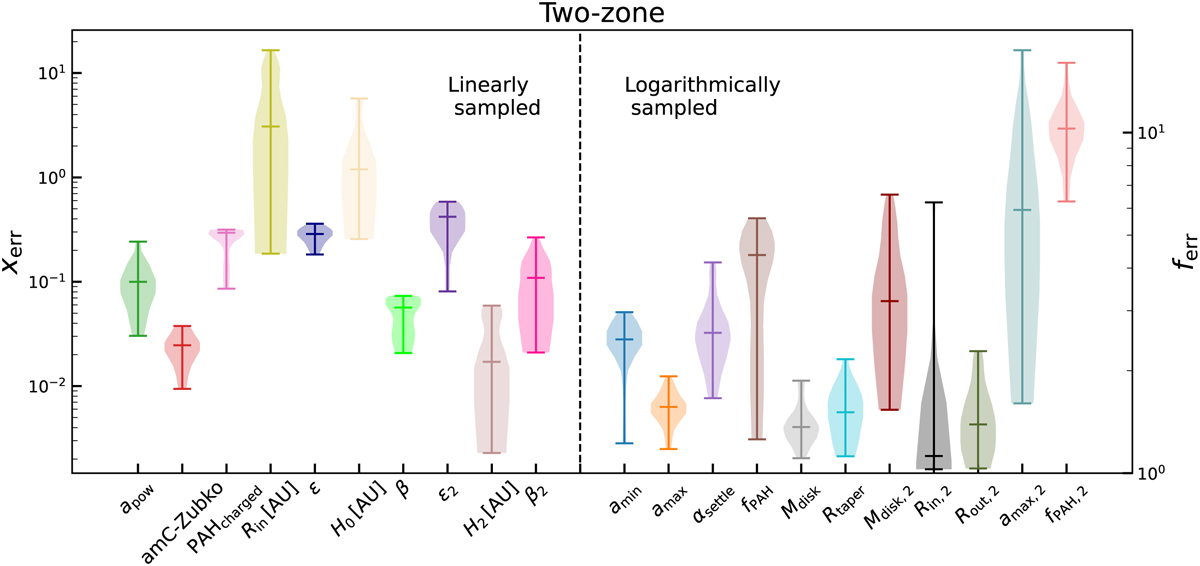
Violin plots showing the uncertainty distribution for all two-zone parameters (Table C.4). For the left part of the plot (left of the dashed black line; linearly sampled parameters) the uncertainties are given in absolute values xerrr according to Eq. (8) corresponding to the left axis. For the right part of the plot (logarithmically sampled parameters), the uncertainties are given as factors ferrr (Eq. (7)) corresponding to the right axis. Every violin depicts the distribution of uncertainties for an individual parameter. The upper, middle, and lower line encode the maximal, median, and minimal uncertainty in the sample, respectively.
Current usage metrics show cumulative count of Article Views (full-text article views including HTML views, PDF and ePub downloads, according to the available data) and Abstracts Views on Vision4Press platform.
Data correspond to usage on the plateform after 2015. The current usage metrics is available 48-96 hours after online publication and is updated daily on week days.
Initial download of the metrics may take a while.