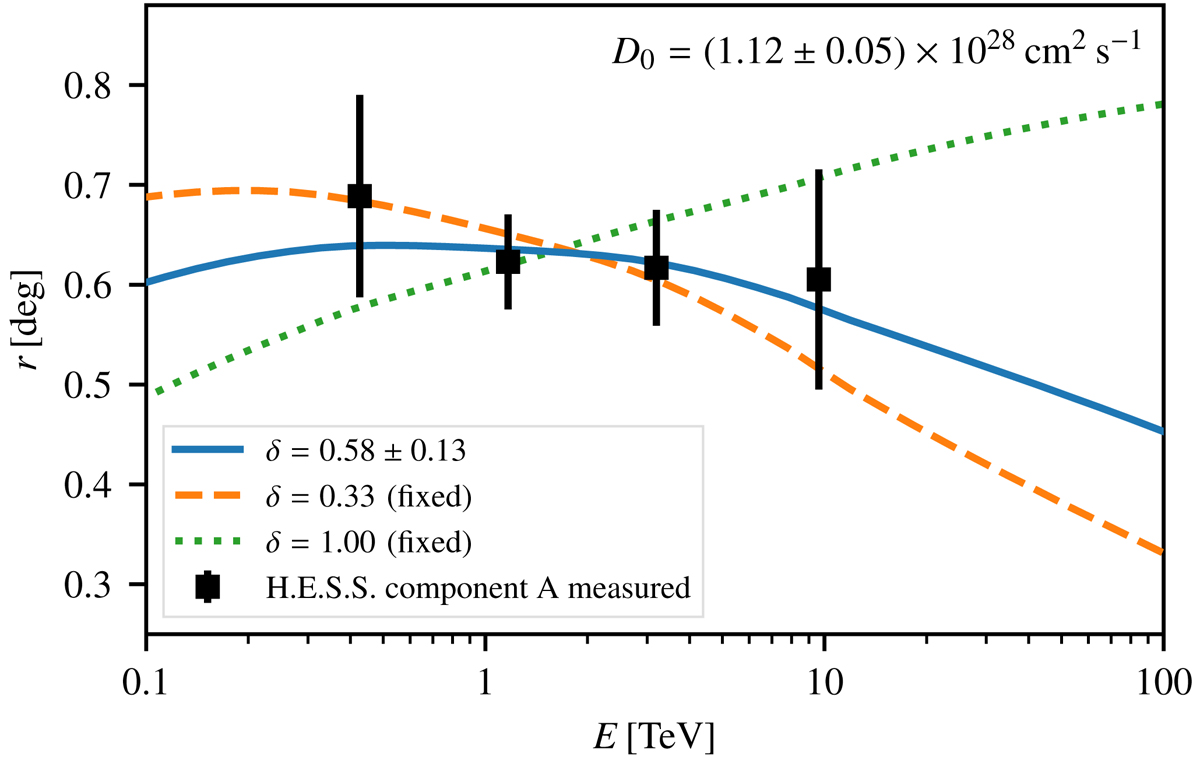
Fig. 9.

Download original image
Measured and predicted radius of the extended component of HESS J1809−193 (component A). As measured radius, we used the 1-σ extent of the semi-major axis of the elongated Gaussian spatial model for component A (cf. Table 1). The solid blue curve has been obtained by fitting the electron diffusion parameters (D0, δ; cf. Eq. (4)) to the measured data points; the dashed orange and dotted green curves show results for fixed values of δ as indicated in the legend.
Current usage metrics show cumulative count of Article Views (full-text article views including HTML views, PDF and ePub downloads, according to the available data) and Abstracts Views on Vision4Press platform.
Data correspond to usage on the plateform after 2015. The current usage metrics is available 48-96 hours after online publication and is updated daily on week days.
Initial download of the metrics may take a while.


