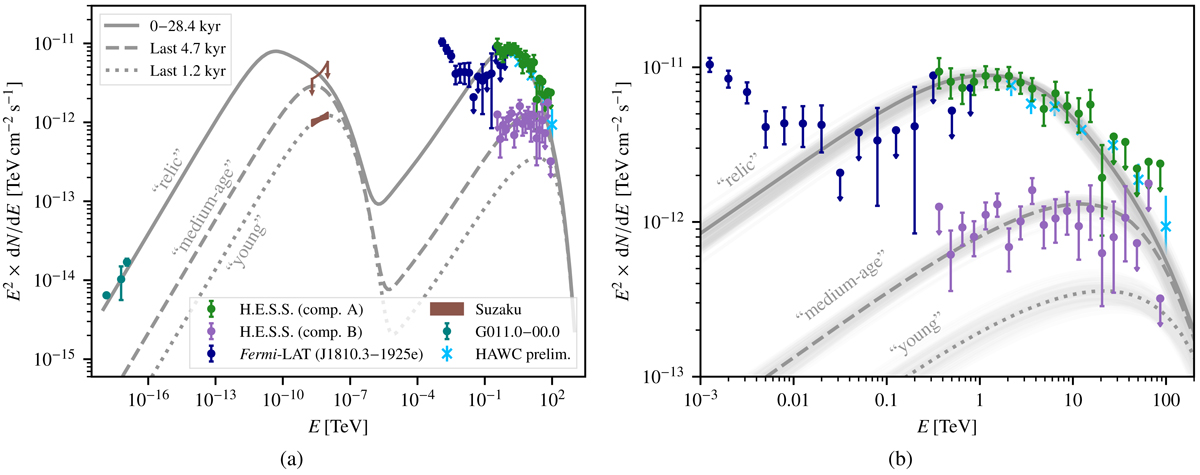
Fig. 8.

Download original image
SED of HESS J1809−193 for the leptonic model. (a) Full energy range. (b) Zoom into high-energy regime. SED curves for the three assumed electron generations, obtained with GAMERA, are shown with dark grey lines. In panel (b), the light grey lines show individual solutions from the MCMC sampling, and thus give an indication of the statistical spread. The H.E.S.S. and Fermi-LAT data points have been derived in this work. The Suzaku X-ray data are from Anada et al. (2010), where the butterfly corresponds to the young electrons (dotted line) and the upper limit refers to the medium-age electrons (dashed line; see main text for details). Shown for comparison but not used in the fit are radio data for G011.0−00.0 (Brogan et al. 2006) and data points from HAWC (Goodman 2022).
Current usage metrics show cumulative count of Article Views (full-text article views including HTML views, PDF and ePub downloads, according to the available data) and Abstracts Views on Vision4Press platform.
Data correspond to usage on the plateform after 2015. The current usage metrics is available 48-96 hours after online publication and is updated daily on week days.
Initial download of the metrics may take a while.


