Fig. 5.
Download original image
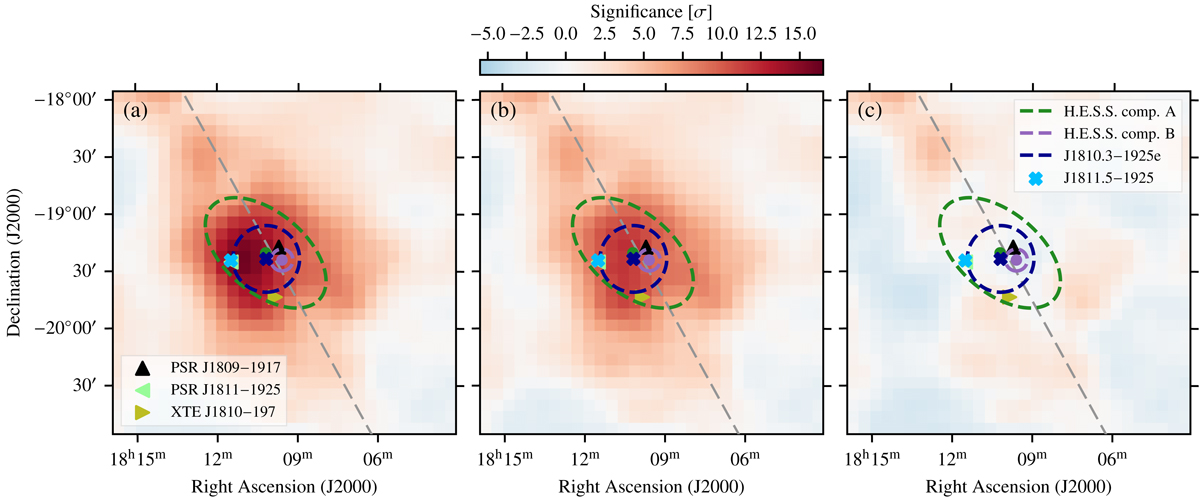
Significance maps above 1 GeV from the Fermi-LAT analysis. (a) With J1811.5−1925 and J1810.3−1925e removed from the best-fit model. (b) With J1810.3−1925e removed from the best-fit model. (c) With all sources included in the model. The light blue cross denotes the fitted position of J1811.5−1925, whereas the dark blue cross and dashed circle display the fitted position and 1-σ extent of J1810.3−1925e. For comparison, the components of the 2-component model fitted to the H.E.S.S. data are shown in green and purple (same as in Fig. 1). The grey dashed line marks the Galactic plane, while the coloured triangle markers denote the positions of PSR J1809−1917, PSR J1811−1925, and XTE J1810−197.
Current usage metrics show cumulative count of Article Views (full-text article views including HTML views, PDF and ePub downloads, according to the available data) and Abstracts Views on Vision4Press platform.
Data correspond to usage on the plateform after 2015. The current usage metrics is available 48-96 hours after online publication and is updated daily on week days.
Initial download of the metrics may take a while.