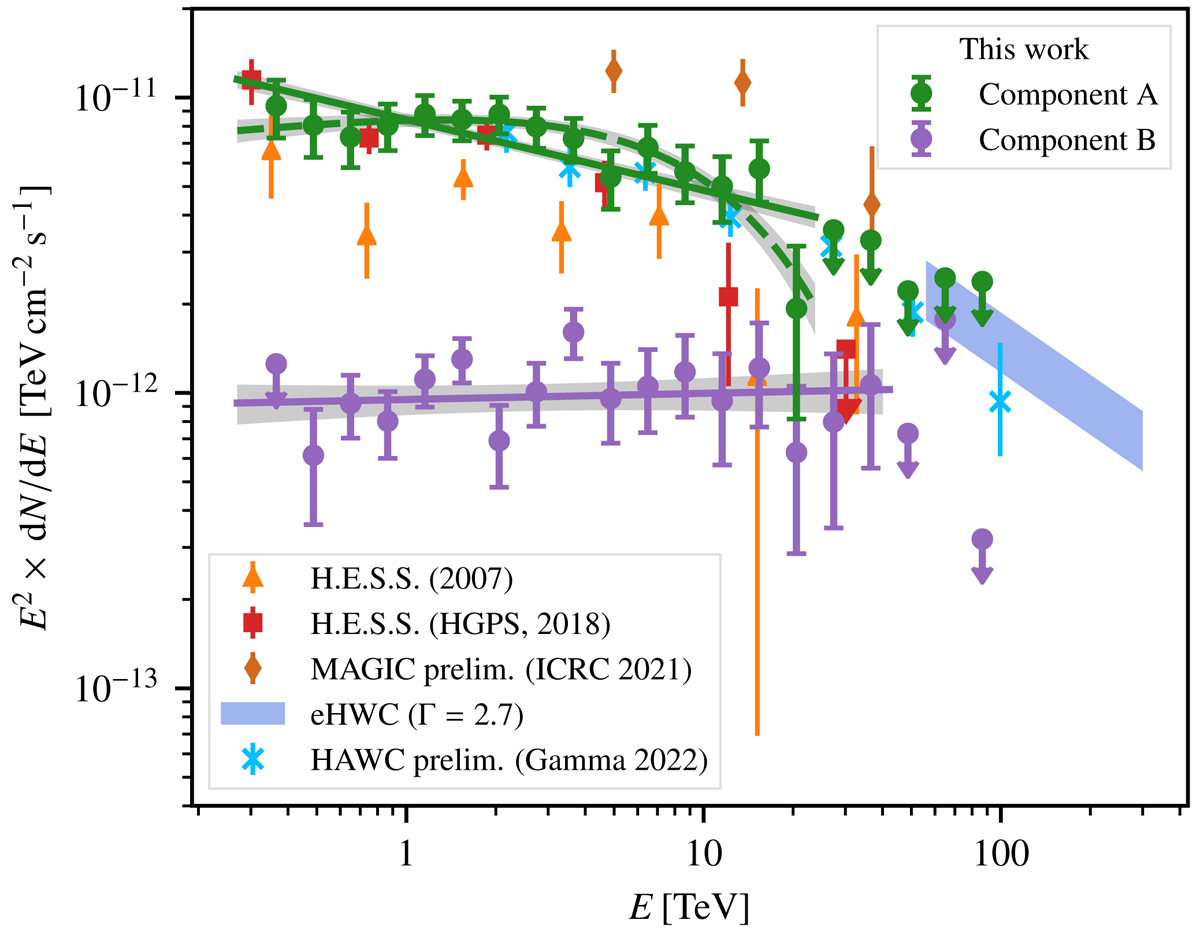
Fig. 4.
Download original image
H.E.S.S. energy spectrum results. We show in green and purple the flux points for component A and component B of the H.E.S.S. analysis, respectively. Upper limits are at 95% confidence level. The solid lines with shaded bands display the best-fit PL model and statistical uncertainty for each of the components. For component A, the dashed green line shows the best-fit ECPL model in addition. The energy spectra are compared to published results, taken from Aharonian et al. (2007), H.E.S.S. Collaboration (2018a), Zarić et al. (2021), Abeysekara et al. (2020), and Goodman (2022).
Current usage metrics show cumulative count of Article Views (full-text article views including HTML views, PDF and ePub downloads, according to the available data) and Abstracts Views on Vision4Press platform.
Data correspond to usage on the plateform after 2015. The current usage metrics is available 48-96 hours after online publication and is updated daily on week days.
Initial download of the metrics may take a while.