Fig. 2.
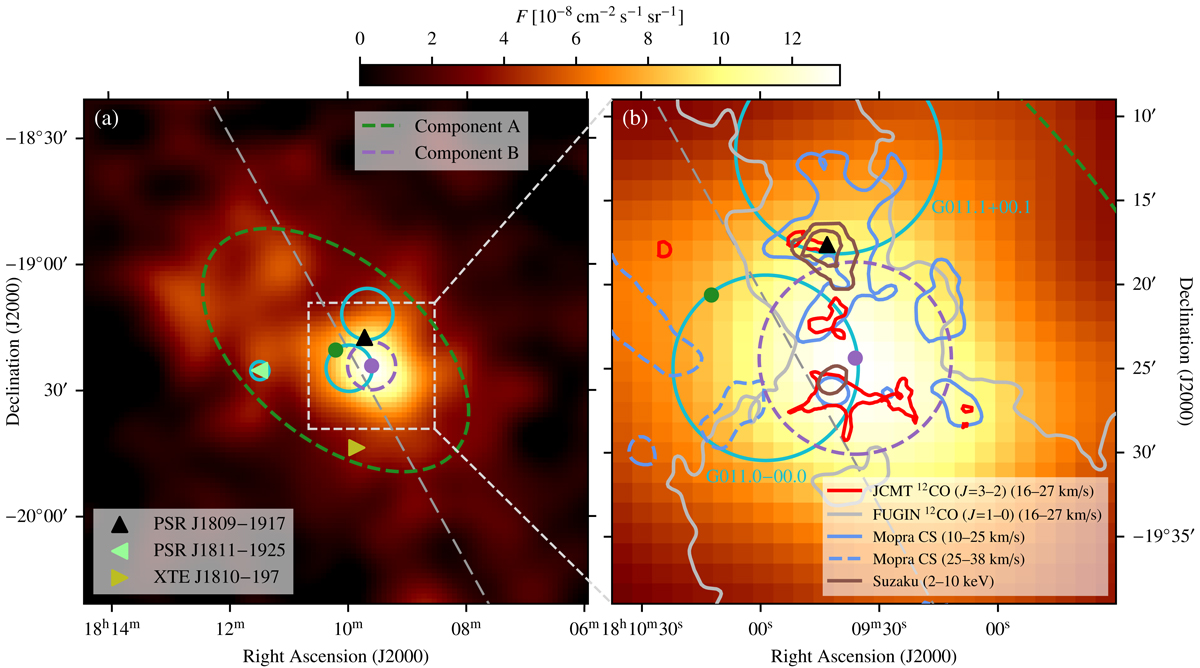
Download original image
Flux maps for HESS J1809−193, above a γ-ray energy of 0.27 TeV. (a) View of the entire emission of HESS J1809−193. (b) Zoom-in on core region. In both panels, light blue circles show the positions of known SNRs, the black triangle marker denotes the position of PSR J1809−1917, and the grey dashed line marks the Galactic plane. The position and extent of component A and component B of the two-component model are displayed in green and purple, respectively. The multi-wavelength data in panel (b) are from the JCMT (Castelletti et al. 2016), the FUGIN survey (Umemoto et al. 2017), the Mopra telescope (Voisin et al. 2019), and the Suzaku X-ray telescope (Anada et al. 2010). The velocity interval for the FUGIN data has been adopted from Castelletti et al. (2016). We computed the flux maps assuming a power law-type spectrum with index −2.2, and have employed a Gaussian kernel with 0.07° radius for smoothing.
Current usage metrics show cumulative count of Article Views (full-text article views including HTML views, PDF and ePub downloads, according to the available data) and Abstracts Views on Vision4Press platform.
Data correspond to usage on the plateform after 2015. The current usage metrics is available 48-96 hours after online publication and is updated daily on week days.
Initial download of the metrics may take a while.