Fig. D.1.
Download original image
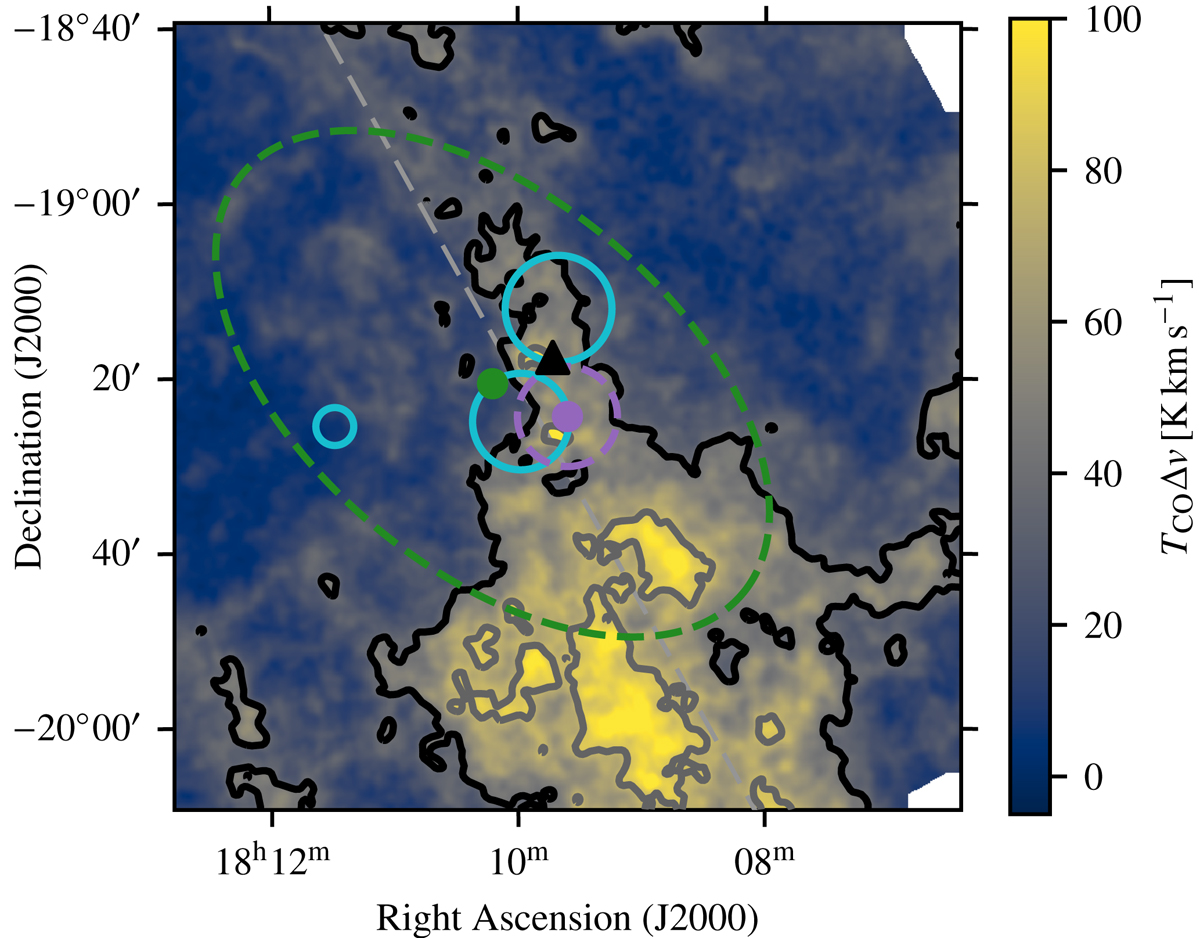
Map of FUGIN 12CO (J = 1–0) line emission in the region surrounding PSR J1809−1917 (Umemoto et al. 2017). Contour lines at 40 K km s−1 and 80 K km s−1 are shown in black and dark grey, respectively. The lines at 40 K km s−1 are also displayed in Fig. 2(b). The black triangle marker denotes the position of PSR J1809−1917, light blue circles show the positions of SNRs, and the grey dashed line marks the Galactic plane. The position and 1-σ extent of component A and component B of HESS J1809−193 are displayed in green and purple, respectively.
Current usage metrics show cumulative count of Article Views (full-text article views including HTML views, PDF and ePub downloads, according to the available data) and Abstracts Views on Vision4Press platform.
Data correspond to usage on the plateform after 2015. The current usage metrics is available 48-96 hours after online publication and is updated daily on week days.
Initial download of the metrics may take a while.