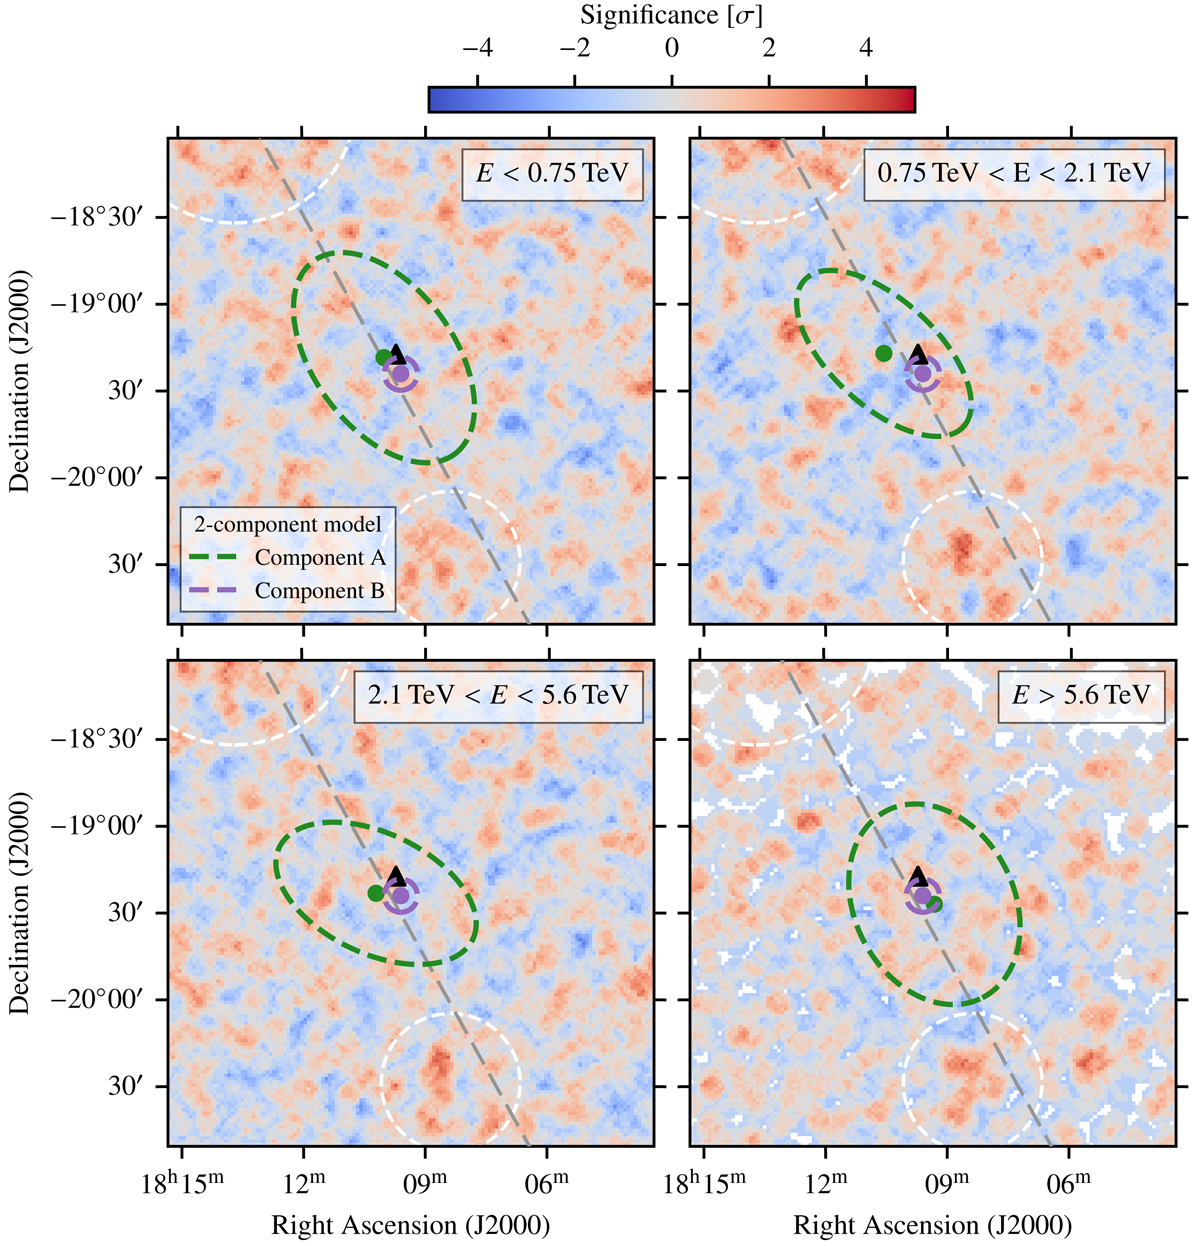
Fig. C.3.
Download original image
Residual significance maps for the 2-component model, fitted in energy bands. We used an oversampling radius of 0.07° for smoothing. Energy bands are specified in the upper right corner of each panel. The green and purple circle marker and dashed line display the best-fit position and 1-sigma extent of the Gaussian models of component A and B, respectively. The grey dashed line marks the Galactic plane, white dashed circles shows regions excluded from the analysis, and the black triangle marker denotes the position of PSR J1809−1917.
Current usage metrics show cumulative count of Article Views (full-text article views including HTML views, PDF and ePub downloads, according to the available data) and Abstracts Views on Vision4Press platform.
Data correspond to usage on the plateform after 2015. The current usage metrics is available 48-96 hours after online publication and is updated daily on week days.
Initial download of the metrics may take a while.