Fig. B.1.

Download original image
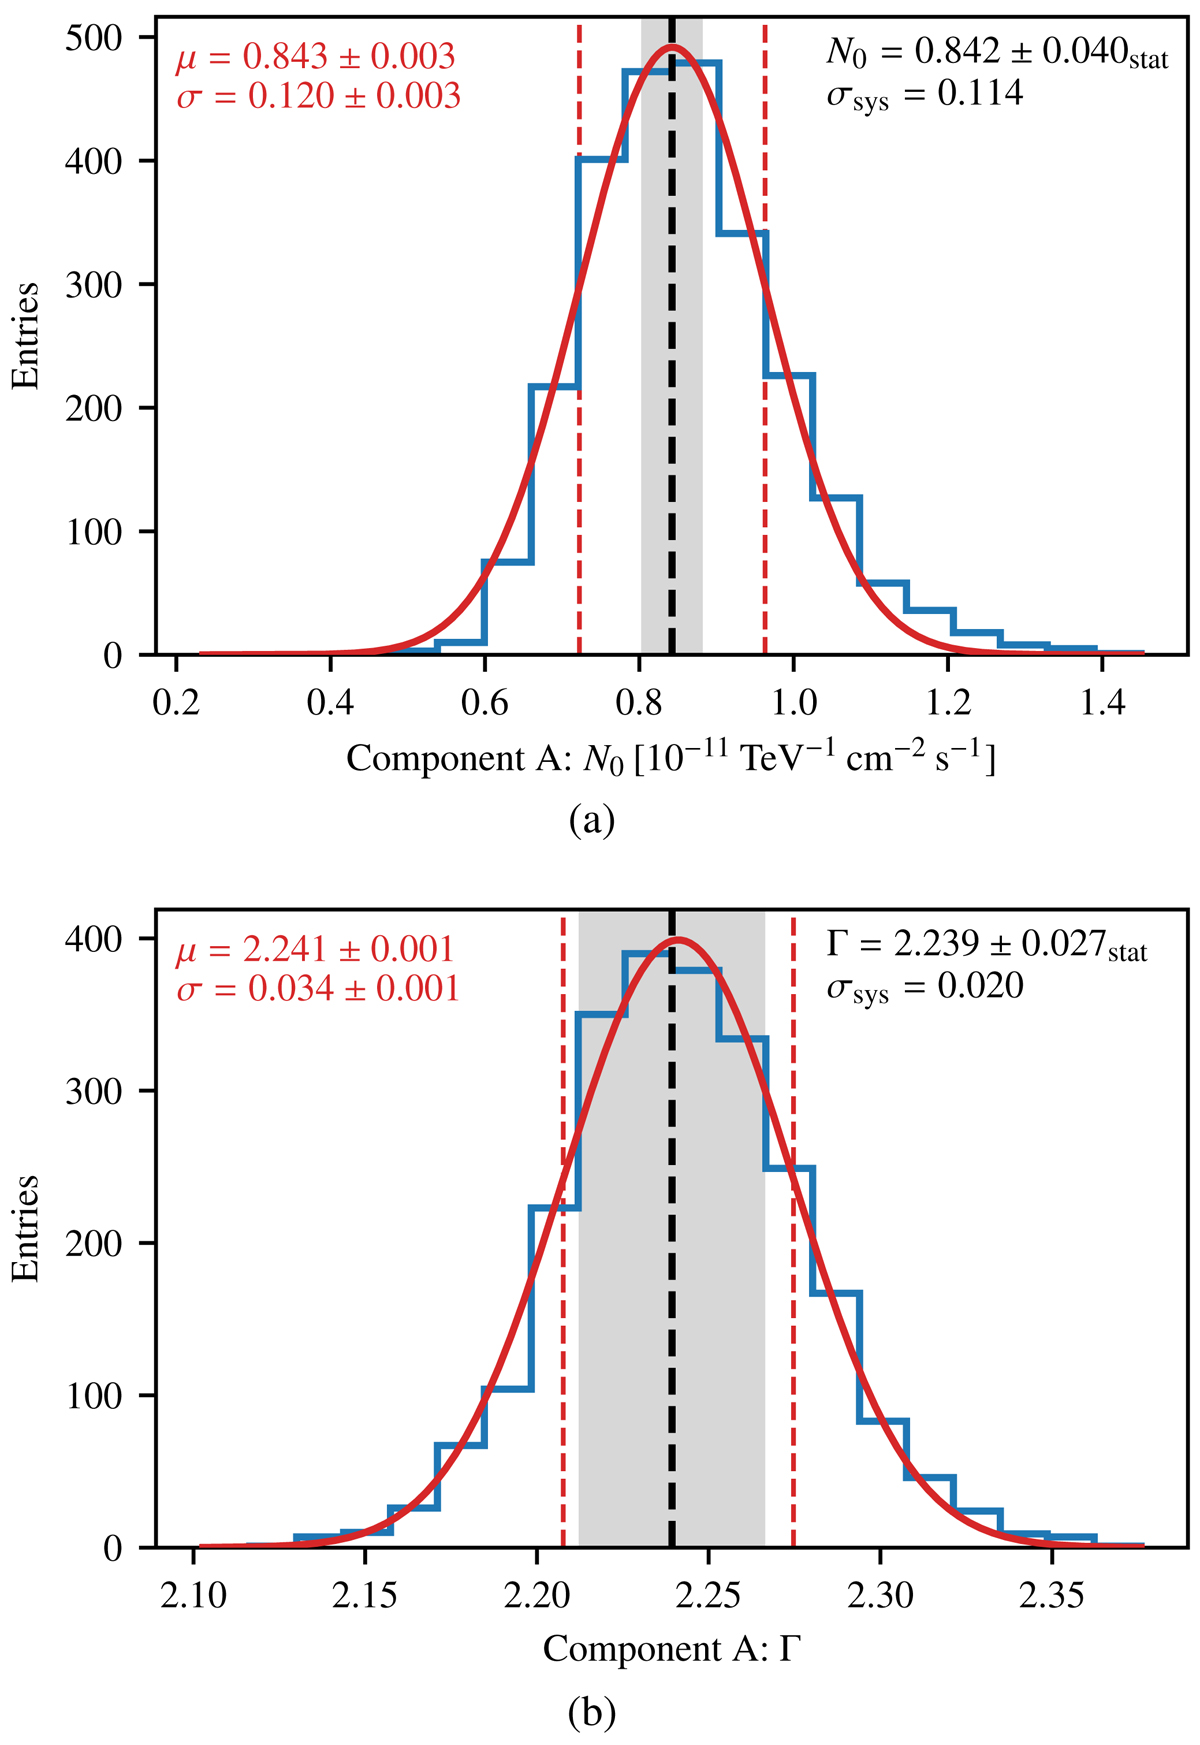
Source parameter distributions for two example parameters. (a) Flux normalisation N0 of source component A. (b) Power-law index Γ of source component A. The black dashed line and grey band denote the best-fit value and statistical uncertainty of this parameter, also specified in the top right corner. The red line shows the fit of a Gaussian to the histogram, where the fitted mean and width are indicated in the top left corner. The red dashed lines indicate the 1-σ width of the fitted Gaussian, which represents the total (i.e. statistical and systematic) uncertainty on this parameter. The derived systematic error, obtained by subtracting quadratically the statistical error from the fitted total width, is also stated in the figure.
Current usage metrics show cumulative count of Article Views (full-text article views including HTML views, PDF and ePub downloads, according to the available data) and Abstracts Views on Vision4Press platform.
Data correspond to usage on the plateform after 2015. The current usage metrics is available 48-96 hours after online publication and is updated daily on week days.
Initial download of the metrics may take a while.


