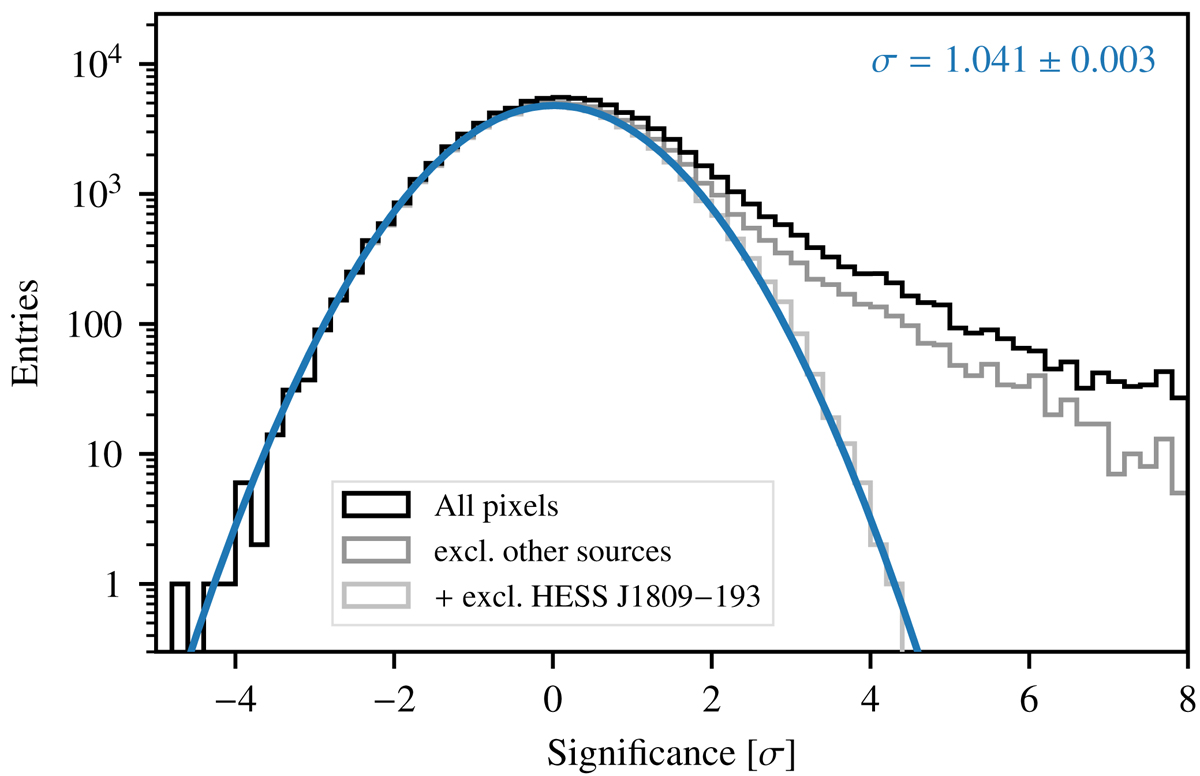
Fig. A.3.
Download original image
Significance distributions for hadronic background model fit. The black histogram shows the distribution of significance values of all spatial pixels of the map in Fig. A.2. The dark grey histogram is for all pixels outside the exclusion regions around HESS J1804−216, HESS J1808−204, and HESS J1813−178 (i.e. contains only the excess from HESS J1809−193), and the light grey histogram is for all pixels outside any of the exclusion regions. The blue line shows the result of fitting a Gaussian distribution to the light grey histogram, the fitted width of the Gaussian is given in the upper right corner of the plot.
Current usage metrics show cumulative count of Article Views (full-text article views including HTML views, PDF and ePub downloads, according to the available data) and Abstracts Views on Vision4Press platform.
Data correspond to usage on the plateform after 2015. The current usage metrics is available 48-96 hours after online publication and is updated daily on week days.
Initial download of the metrics may take a while.