Fig. 7
Download original image
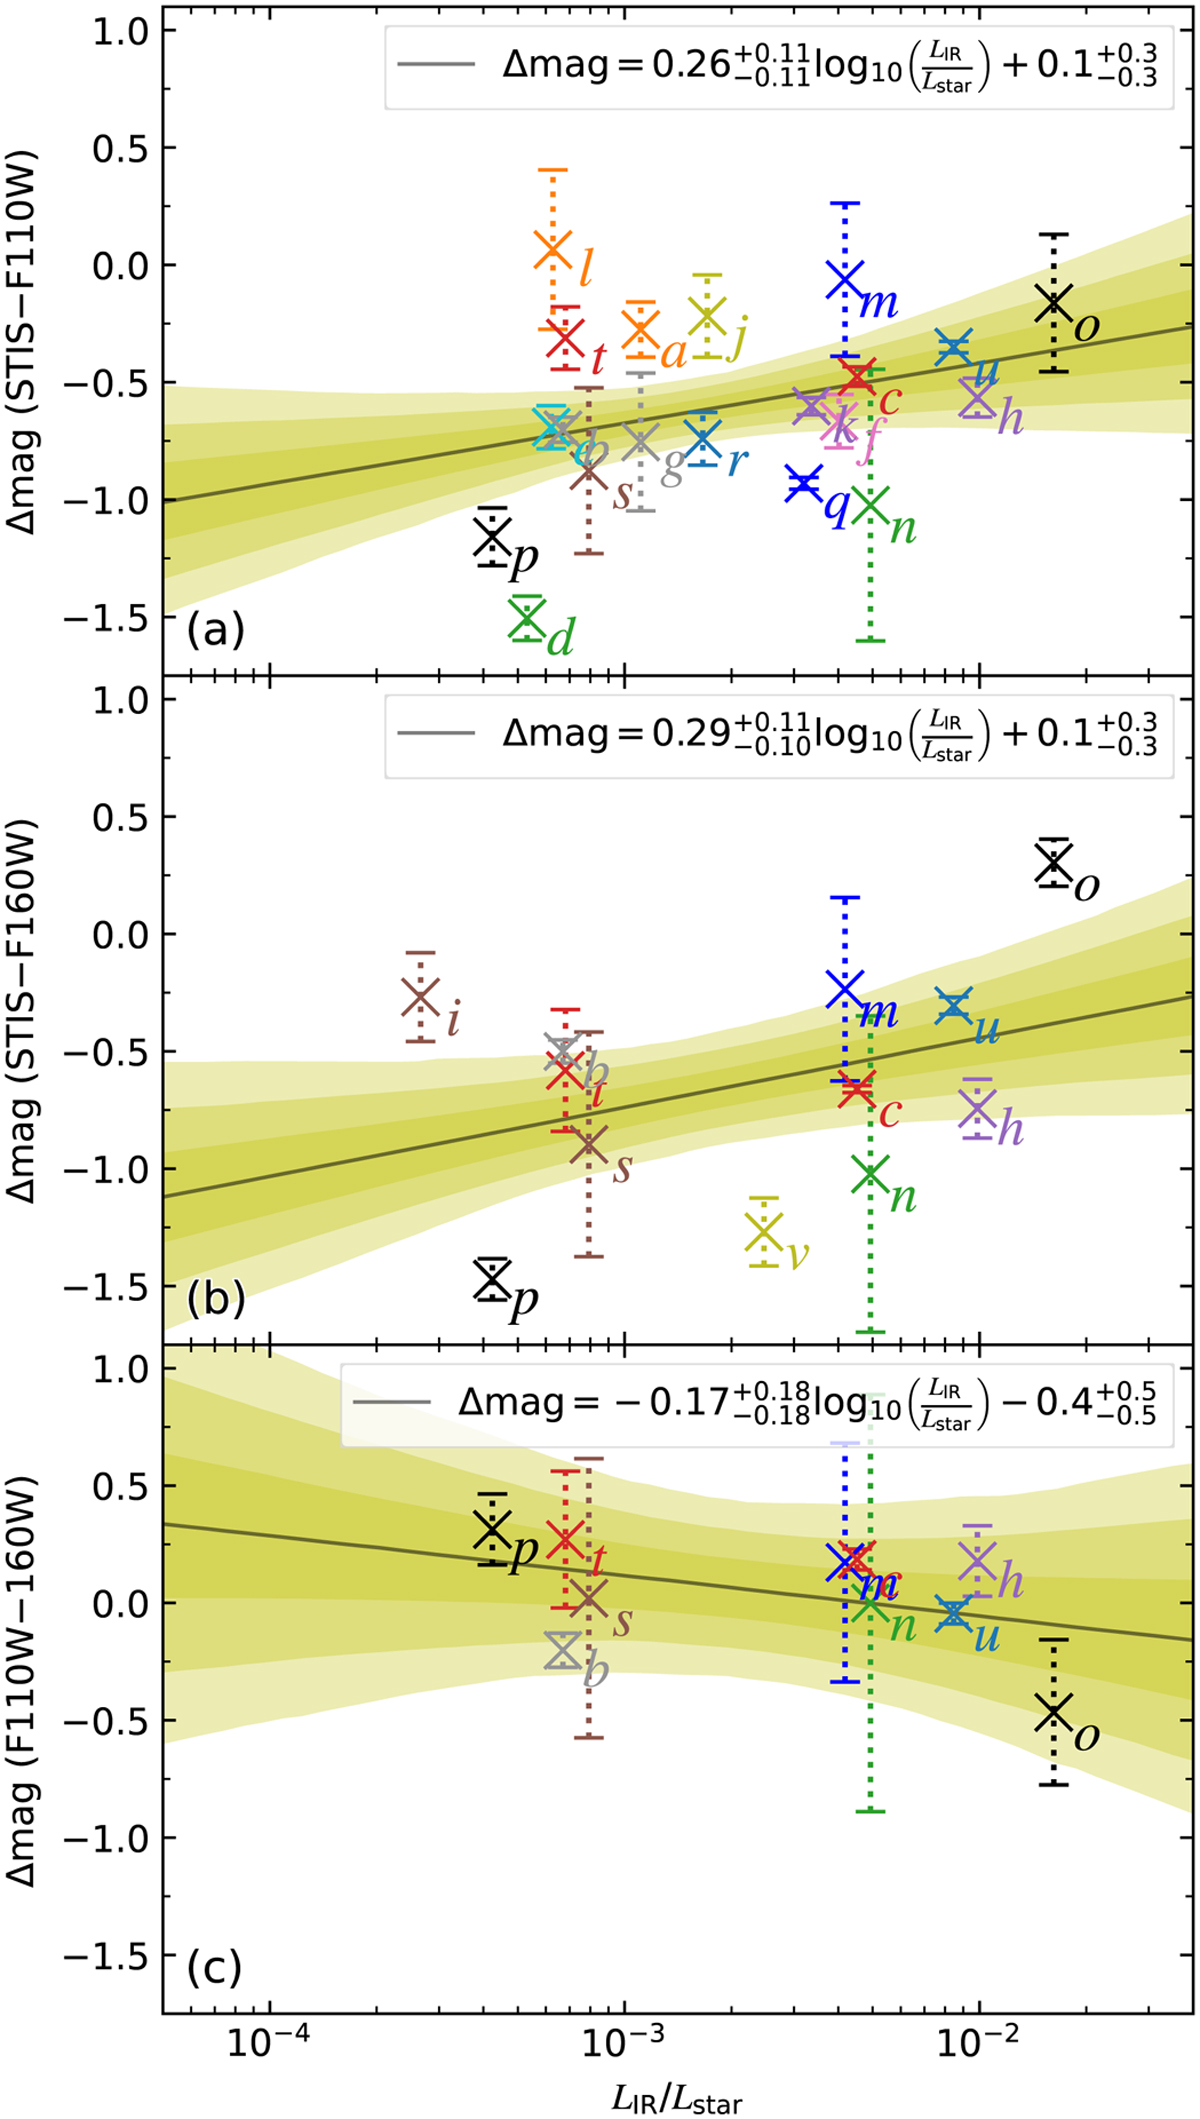
Dust color as a function of fractional infrared excess. Panels a, b, and c are for STIS–F110W, STIS–F160W, and F110W–F160W, respectively. With a caveat that infrared excess and stellar luminosity are positively correlated in Sect. 4.3, there might be marginal trends of the STIS–NICMOS color being more neutral for disks with higher fractional infrared excess.
Current usage metrics show cumulative count of Article Views (full-text article views including HTML views, PDF and ePub downloads, according to the available data) and Abstracts Views on Vision4Press platform.
Data correspond to usage on the plateform after 2015. The current usage metrics is available 48-96 hours after online publication and is updated daily on week days.
Initial download of the metrics may take a while.