Fig. A.5
Download original image
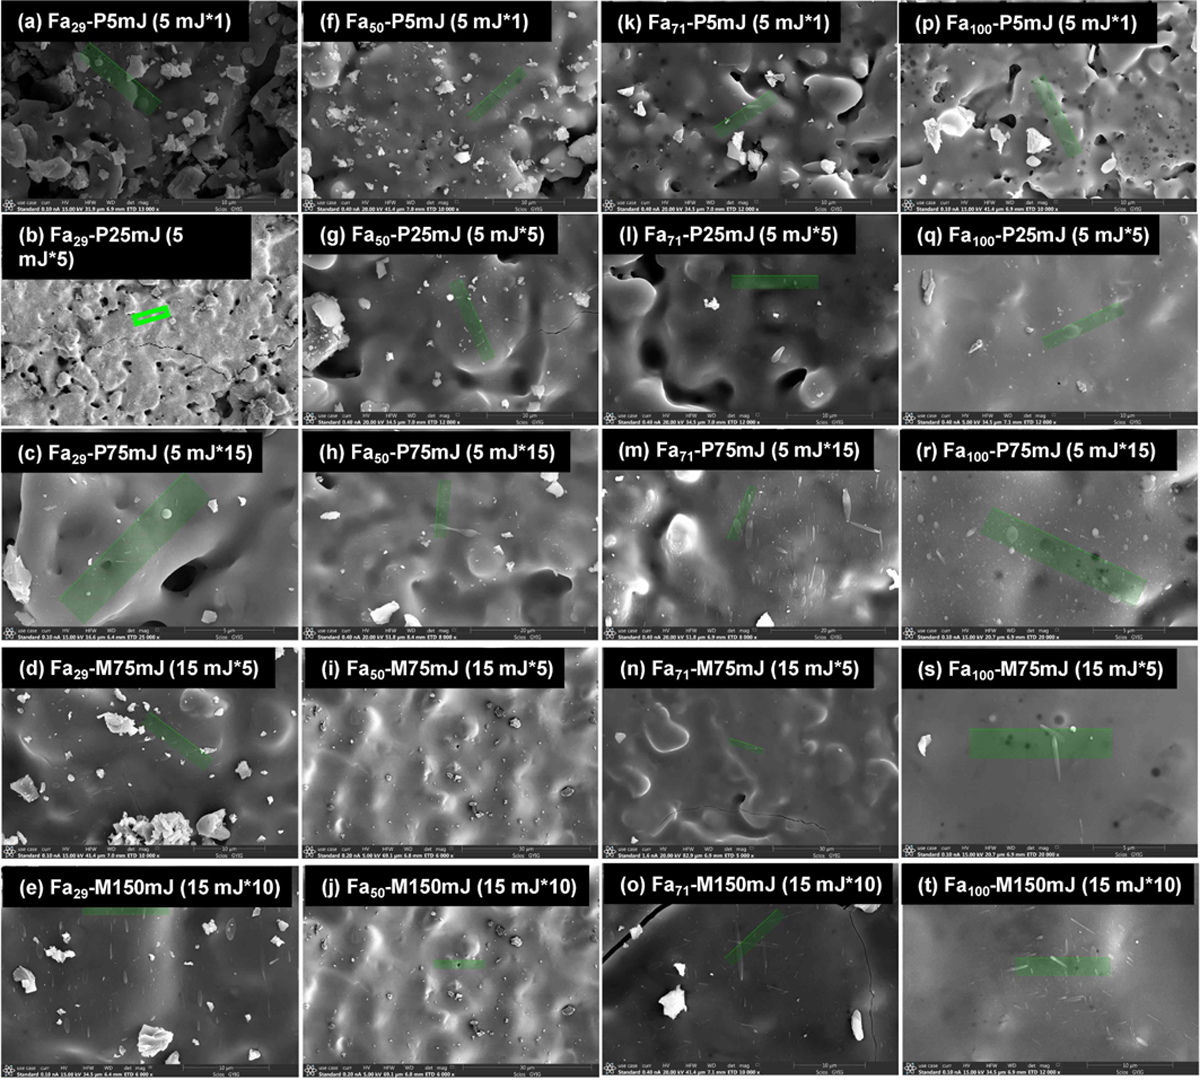
Secondary electron images showing the locations from which the FIB slices were extracted from the laser-irradiated pits on the olivine targets. The locations are shown in green boxes. Each column represents olivine with the same Fa# values. From left to right, Fa29, Fa50, Fa71, and Fa100100 are shown. Each row represents the same irradiation energy levels. From top to bottom, P5mJ, P25mJ, P75mJ, M75mJ, and M150mJ energy levels are shown.
Current usage metrics show cumulative count of Article Views (full-text article views including HTML views, PDF and ePub downloads, according to the available data) and Abstracts Views on Vision4Press platform.
Data correspond to usage on the plateform after 2015. The current usage metrics is available 48-96 hours after online publication and is updated daily on week days.
Initial download of the metrics may take a while.