Fig. 3
Download original image
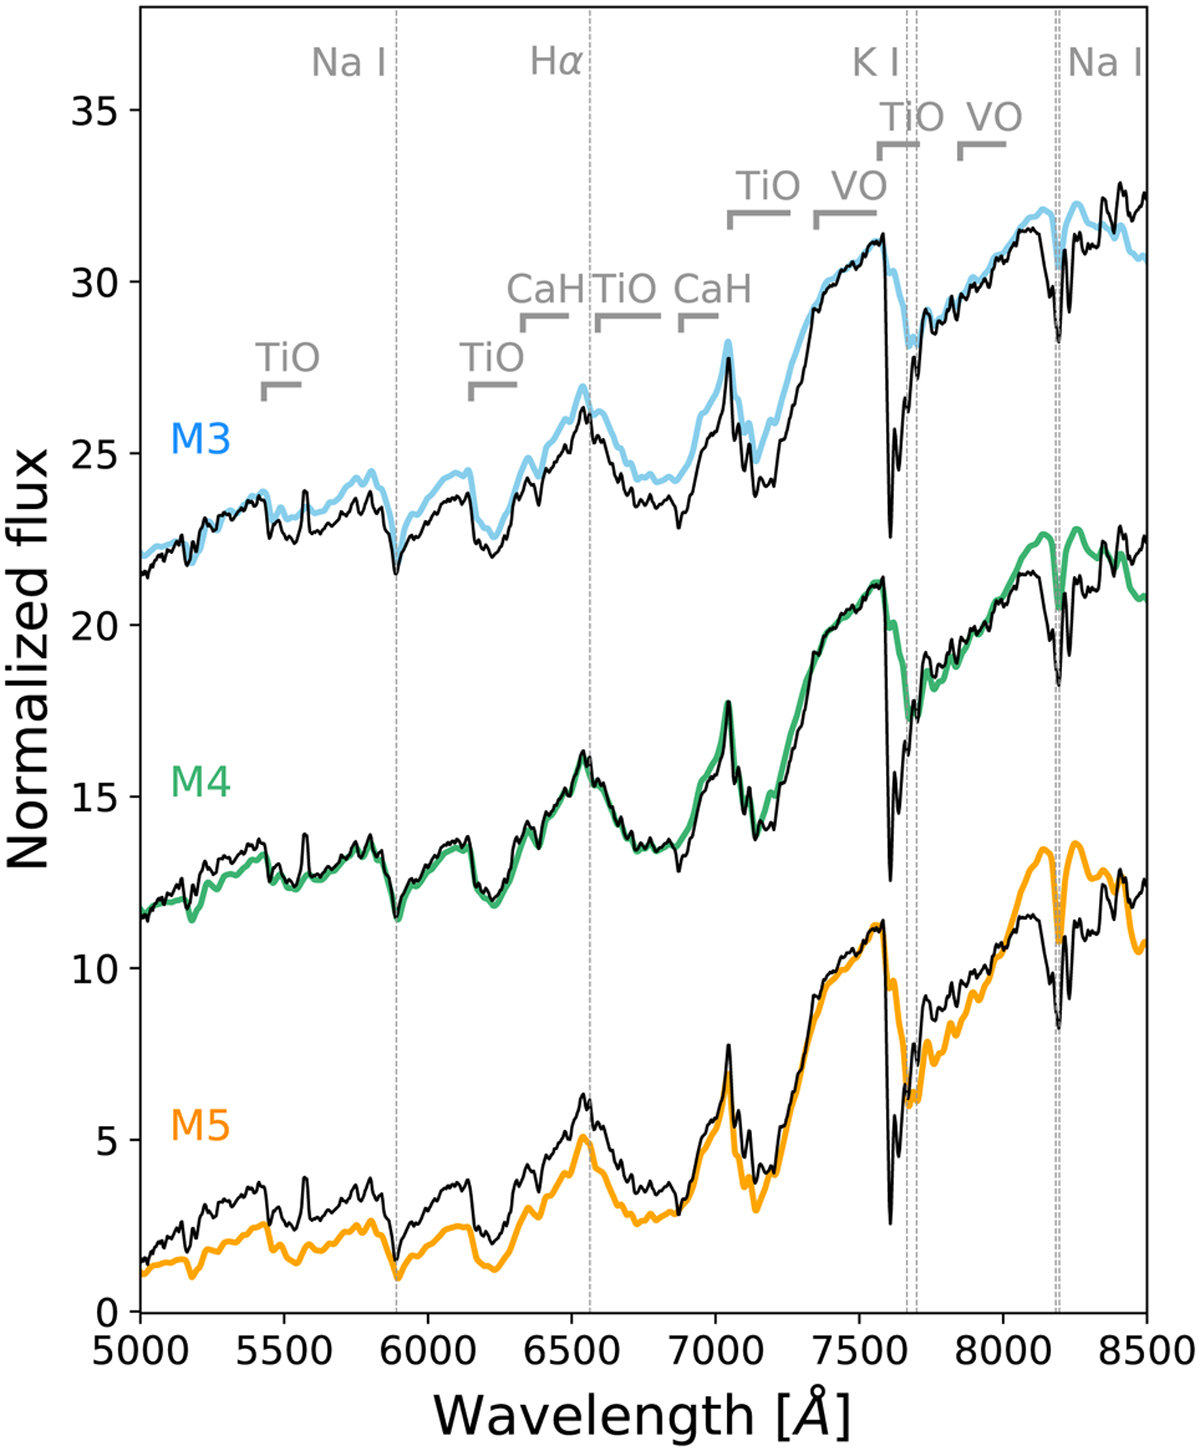
NOT/ALFOSC optical spectrum of TOI-2096 (black) compared to SDSS M3, M4, and M5 templates Bochanski et al. (2007) and Kesseli et al. (2017, colored). The SDSS spectra were convolved using a Gaussian function to match the ALFOSC spectrum resolution. The spectra were normalized at ~7500 A and shifted by a constant. Some remarkable absorption bands and lines are labeled in gray.
Current usage metrics show cumulative count of Article Views (full-text article views including HTML views, PDF and ePub downloads, according to the available data) and Abstracts Views on Vision4Press platform.
Data correspond to usage on the plateform after 2015. The current usage metrics is available 48-96 hours after online publication and is updated daily on week days.
Initial download of the metrics may take a while.