Fig. 17
Download original image
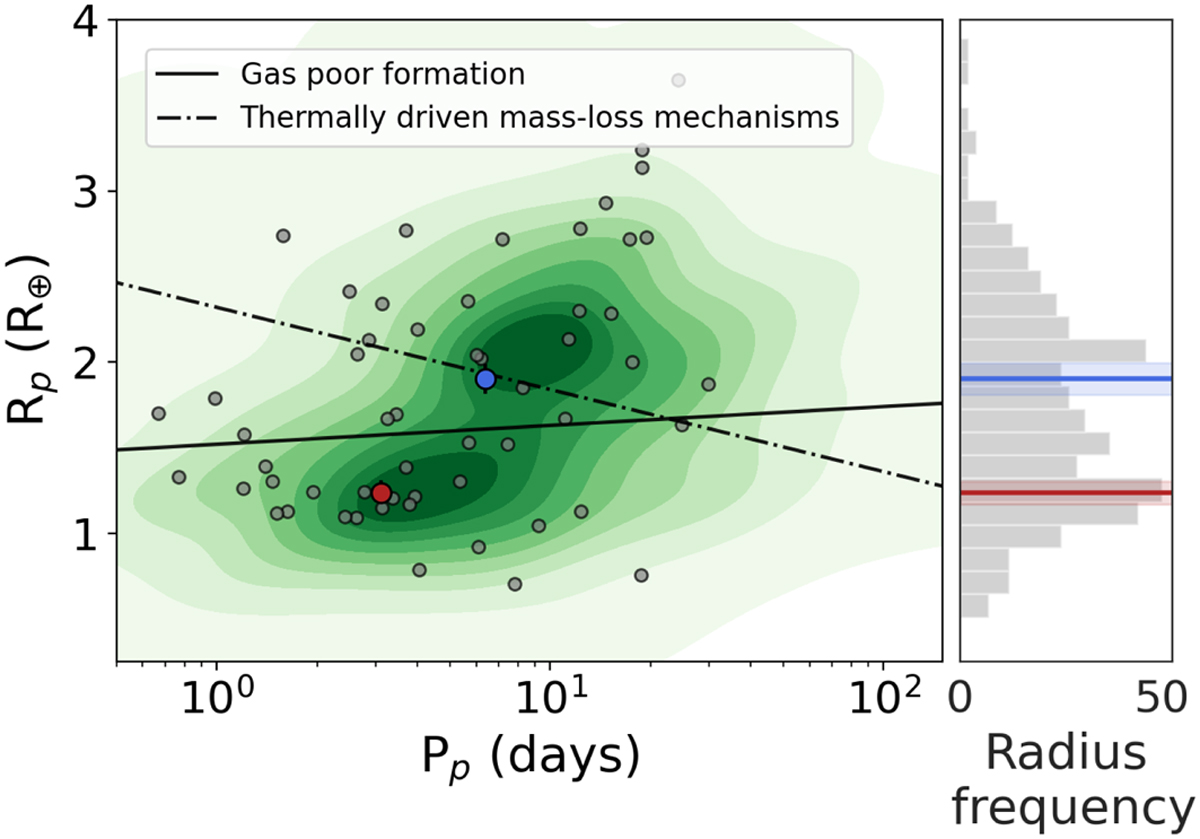
The left panel depicts the planet radius-orbital period plane, containing all the transiting planets with sizes <4 R⊕ orbiting low-mass stars (stellar mass <0.70 M⊙). The green contours represent the density distribution of all of these planets. The gray dots are planets with density estimations better than 30%. The dashed line refers to the prediction using thermally driven mass-loss mechanisms, such as photoevapora-tion and core-powered mass-loss. On the other hand, the solid line represents the prediction from the gas-poor formation model. Planets inside the region limited by these two lines are referred to as ‘keystone’ planets. The red and the blue dots refer to the planets TOI-2096 b and c, respectively. The right panel displays the radius frequency, showing the radius valley and the location of planets b (red band) and c (blue band) encompassing it.
Current usage metrics show cumulative count of Article Views (full-text article views including HTML views, PDF and ePub downloads, according to the available data) and Abstracts Views on Vision4Press platform.
Data correspond to usage on the plateform after 2015. The current usage metrics is available 48-96 hours after online publication and is updated daily on week days.
Initial download of the metrics may take a while.