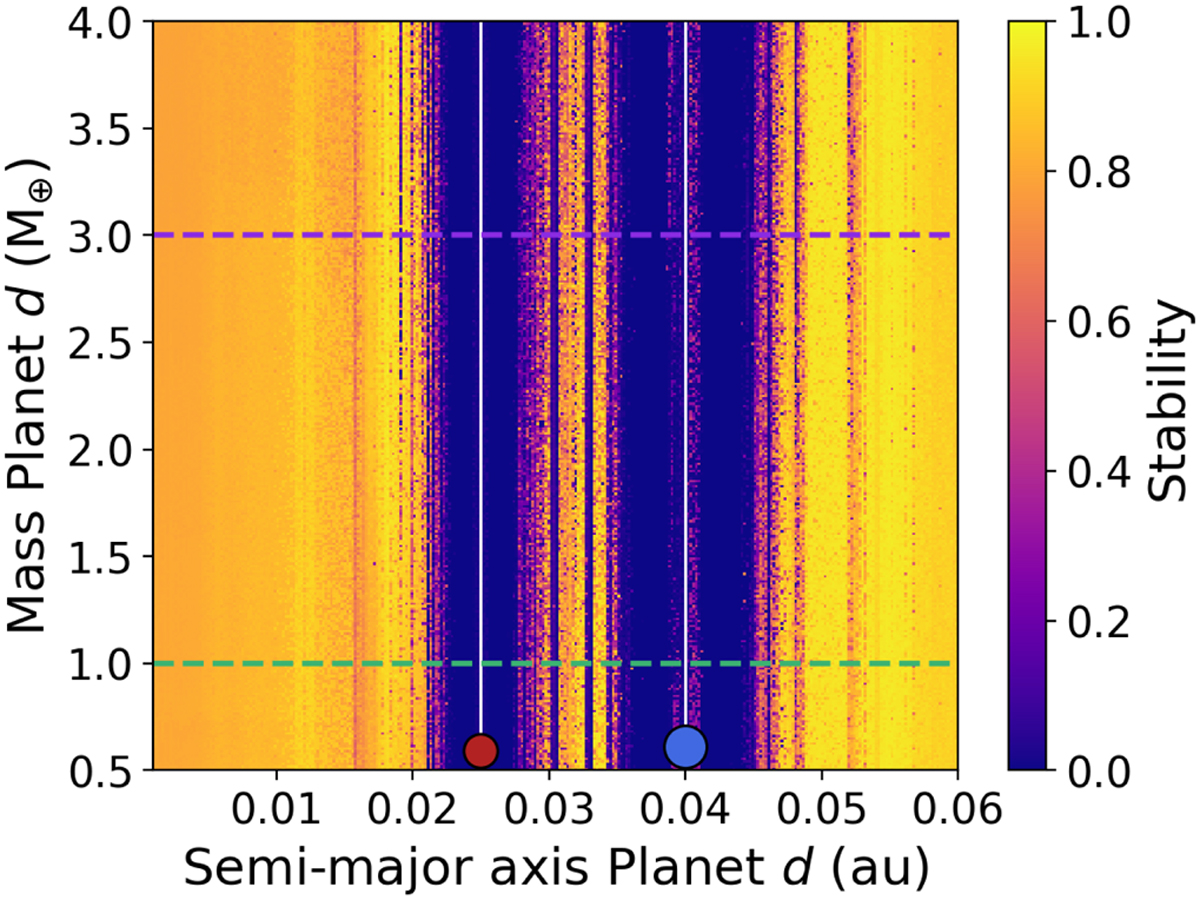
Fig. 15
Download original image
Stability map of TOI-2096 when a hypothetical third planet is injected into the system. The map contains 300 × 300 pixels, in the Md–ad parameter space. The stability of each scenario is evaluated using the SPOCK package, establishing the level of stability of a given configuration with a value ranging from 0 (unstable) to 1 (fully stable). Then, the yellow regions refer to stable cases, while dark-blue hues are unstable. The horizontal dashed lines remark the particular cases of masses corresponding to 1.0 (green) and 3.0 M⊕ (purple), which are displayed in Fig.16. The vertical white lines refer to the orbital locations of planets b (bottom red dot) and c (bottom blue dot).
Current usage metrics show cumulative count of Article Views (full-text article views including HTML views, PDF and ePub downloads, according to the available data) and Abstracts Views on Vision4Press platform.
Data correspond to usage on the plateform after 2015. The current usage metrics is available 48-96 hours after online publication and is updated daily on week days.
Initial download of the metrics may take a while.