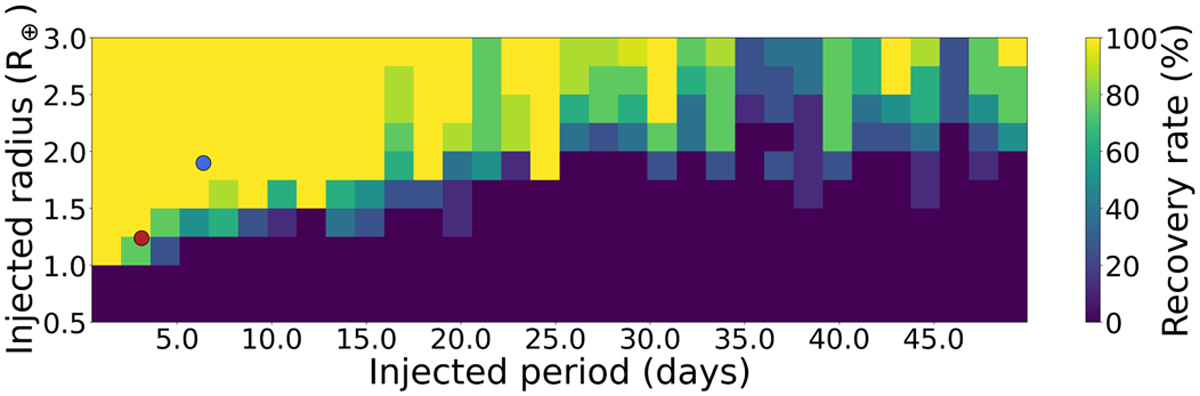
Fig. 12
Download original image
Injection-and-recovery experiment performed to test the detectability of extra planets in the system using the six TESS sectors described in Sect. 2. We explored a total of 2156 different scenarios. Each pixel evaluated about 6 scenarios, that is, 6 light curves with injected planets having different Pplanet, Rplanet, and T0. Larger recovery rates are presented in yellow and green colors, while lower recovery rates are shown in blue and darker hues. Planets smaller than 1.0 R⊕ would remain undetected for the explored periods. Red and blue dots refer to the planets TOI-2096 b, and c, respectively.
Current usage metrics show cumulative count of Article Views (full-text article views including HTML views, PDF and ePub downloads, according to the available data) and Abstracts Views on Vision4Press platform.
Data correspond to usage on the plateform after 2015. The current usage metrics is available 48-96 hours after online publication and is updated daily on week days.
Initial download of the metrics may take a while.