Fig. 8.
Download original image
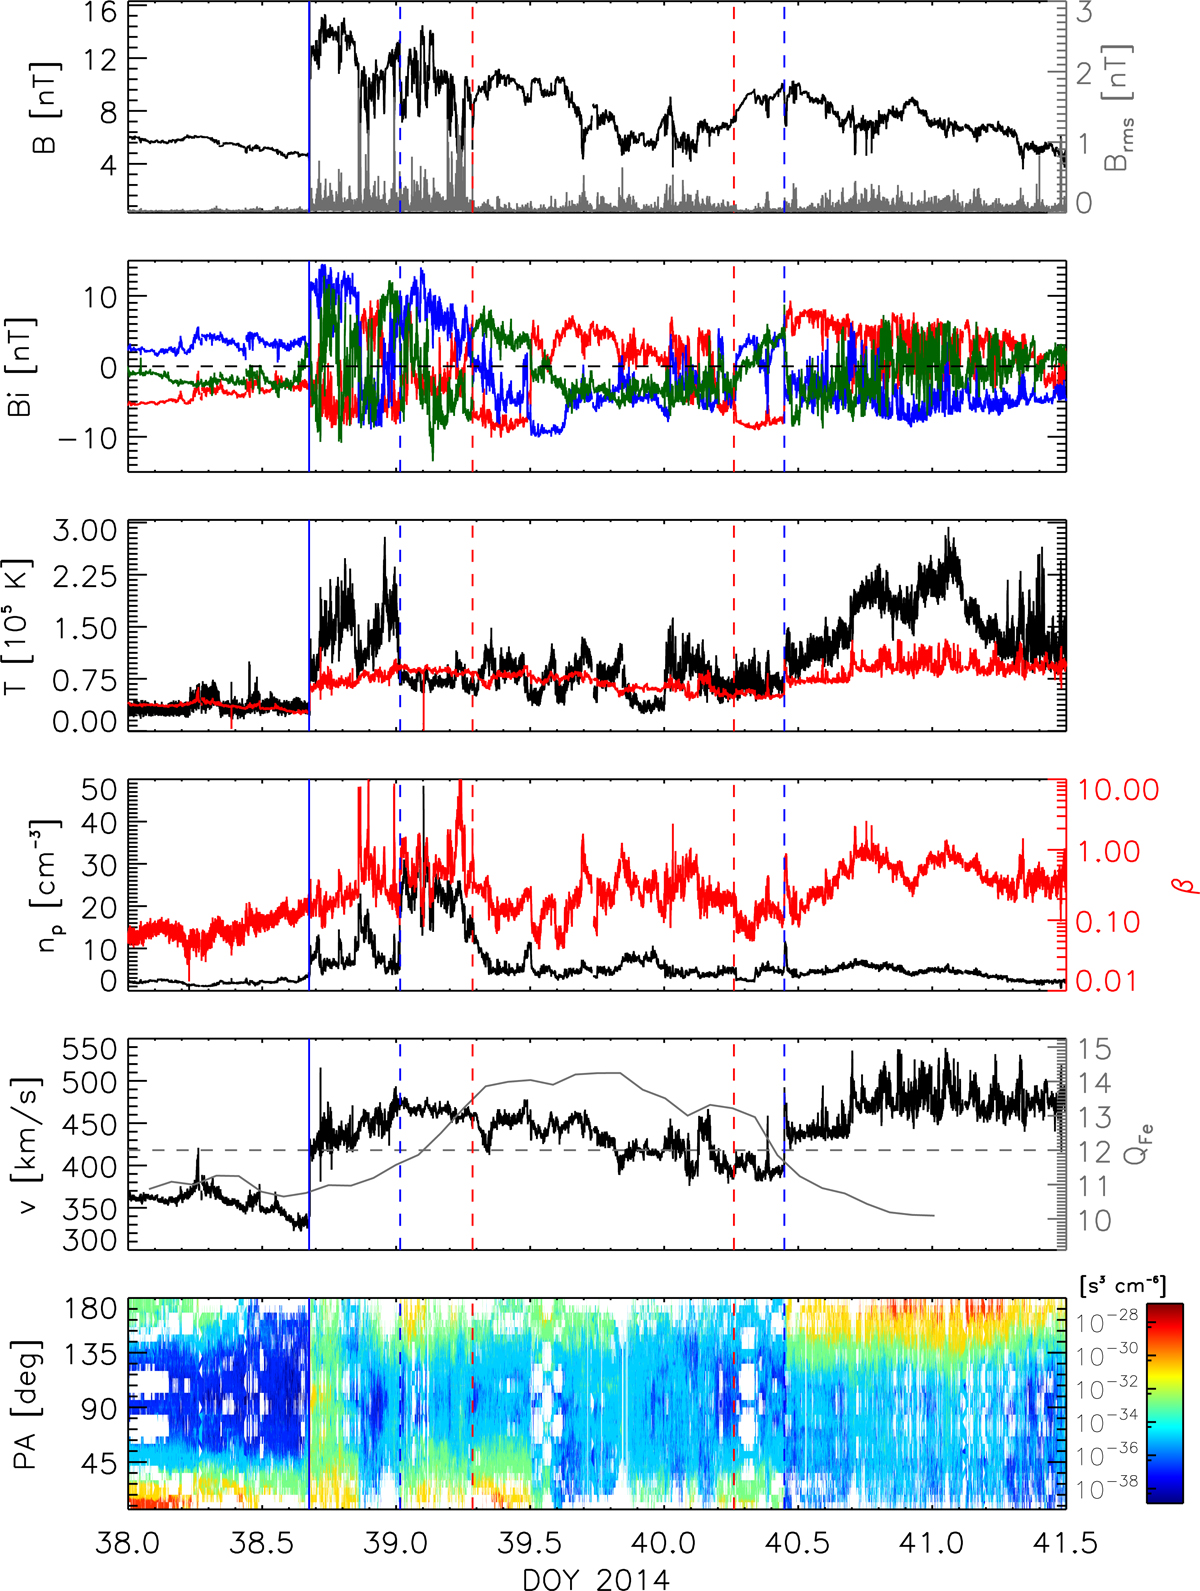
Plasma and magnetic field measurements for the interval of ICME disturbance. The first panel shows the absolute magnetic field strength in black and its fluctuation in gray. The second panel shows the geocentric solar ecliptic (GSE) components of the magnetic field, and in red, we show the x-component, in blue the y-component, and in green the z-component. The horizontal dashed line marks 0. The third panel shows the plasma temperature in black and the expected temperature (Lopez 1987) in red. The fourth panel displays the proton density (black) and the plasma β (red). The fifth panel shows the proton speed in black and the iron charge state in gray, and the dashed gray line marks a charge state of 12. The last panel shows the PAD of electrons with energies of 116.1 eV, in which the lowest counts are depicted in dark blue and the highest counts in dark red. In all the panels, the solid vertical blue line marks the occurrence of a fast forward shock on February 8 at 16:15 UT. Then, the dashed vertical blue line indicates the end of the sheath region and the beginning of ICME frontal region on February 9 at 00:30 UT. The dashed vertical red line that follows is indicative of the main ICME part starting at 05:30 UT. The second dashed red line marks the beginning of small FR-like field developments on February 10 at 06:00 UT. Finally, the second dashed blue line indicates a slow-mode wave that is simultaneous with the end of the ICME disturbance and onset of the HSS stream, at 10:45 UT.
Current usage metrics show cumulative count of Article Views (full-text article views including HTML views, PDF and ePub downloads, according to the available data) and Abstracts Views on Vision4Press platform.
Data correspond to usage on the plateform after 2015. The current usage metrics is available 48-96 hours after online publication and is updated daily on week days.
Initial download of the metrics may take a while.