Fig. 11.
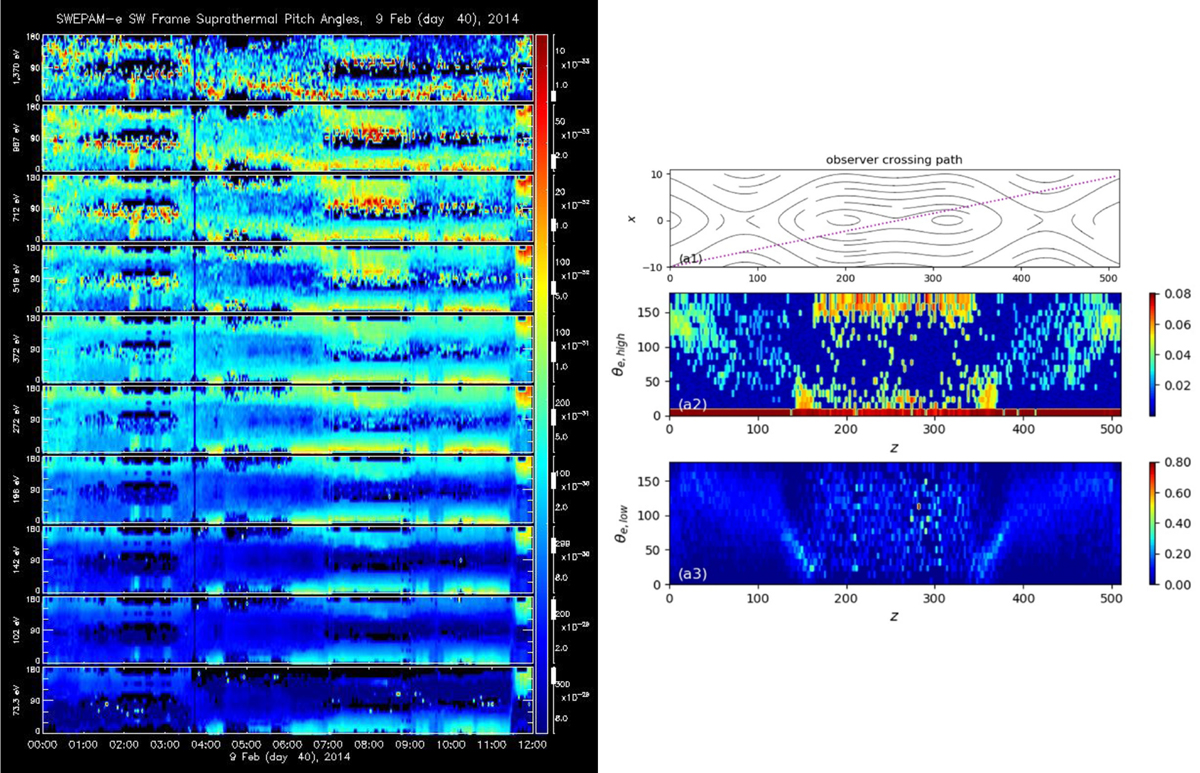
Download original image
Comparison of measured and simulated PAD data. Left: pitch-angle data from ACE/SWEPAM for the back region of the ICME. All the measured energy channels are plotted, with the highest energy in the top panel and the lowest energy in the bottom panel. Right: Fig. 39 from Khabarova et al. (2020) showing the simulated PAD for a merging MI close to a reconnecting current sheet. The top panel shows the trajectory of a virtual spacecraft through the merging MI. In the middle panel, normalized high-energy PAD measurements of this virtual spacecraft are plotted. The bottom panel shows the measurements for low-energy channels. The counterstreaming in the highest-energy channels on the left is focused at 07–09 UT, similar to the simulated PAD on the right. Figure 39 from Khabarova et al. (2020) reproduced with permission from SNCSC.
Current usage metrics show cumulative count of Article Views (full-text article views including HTML views, PDF and ePub downloads, according to the available data) and Abstracts Views on Vision4Press platform.
Data correspond to usage on the plateform after 2015. The current usage metrics is available 48-96 hours after online publication and is updated daily on week days.
Initial download of the metrics may take a while.