Fig. 10.
Download original image
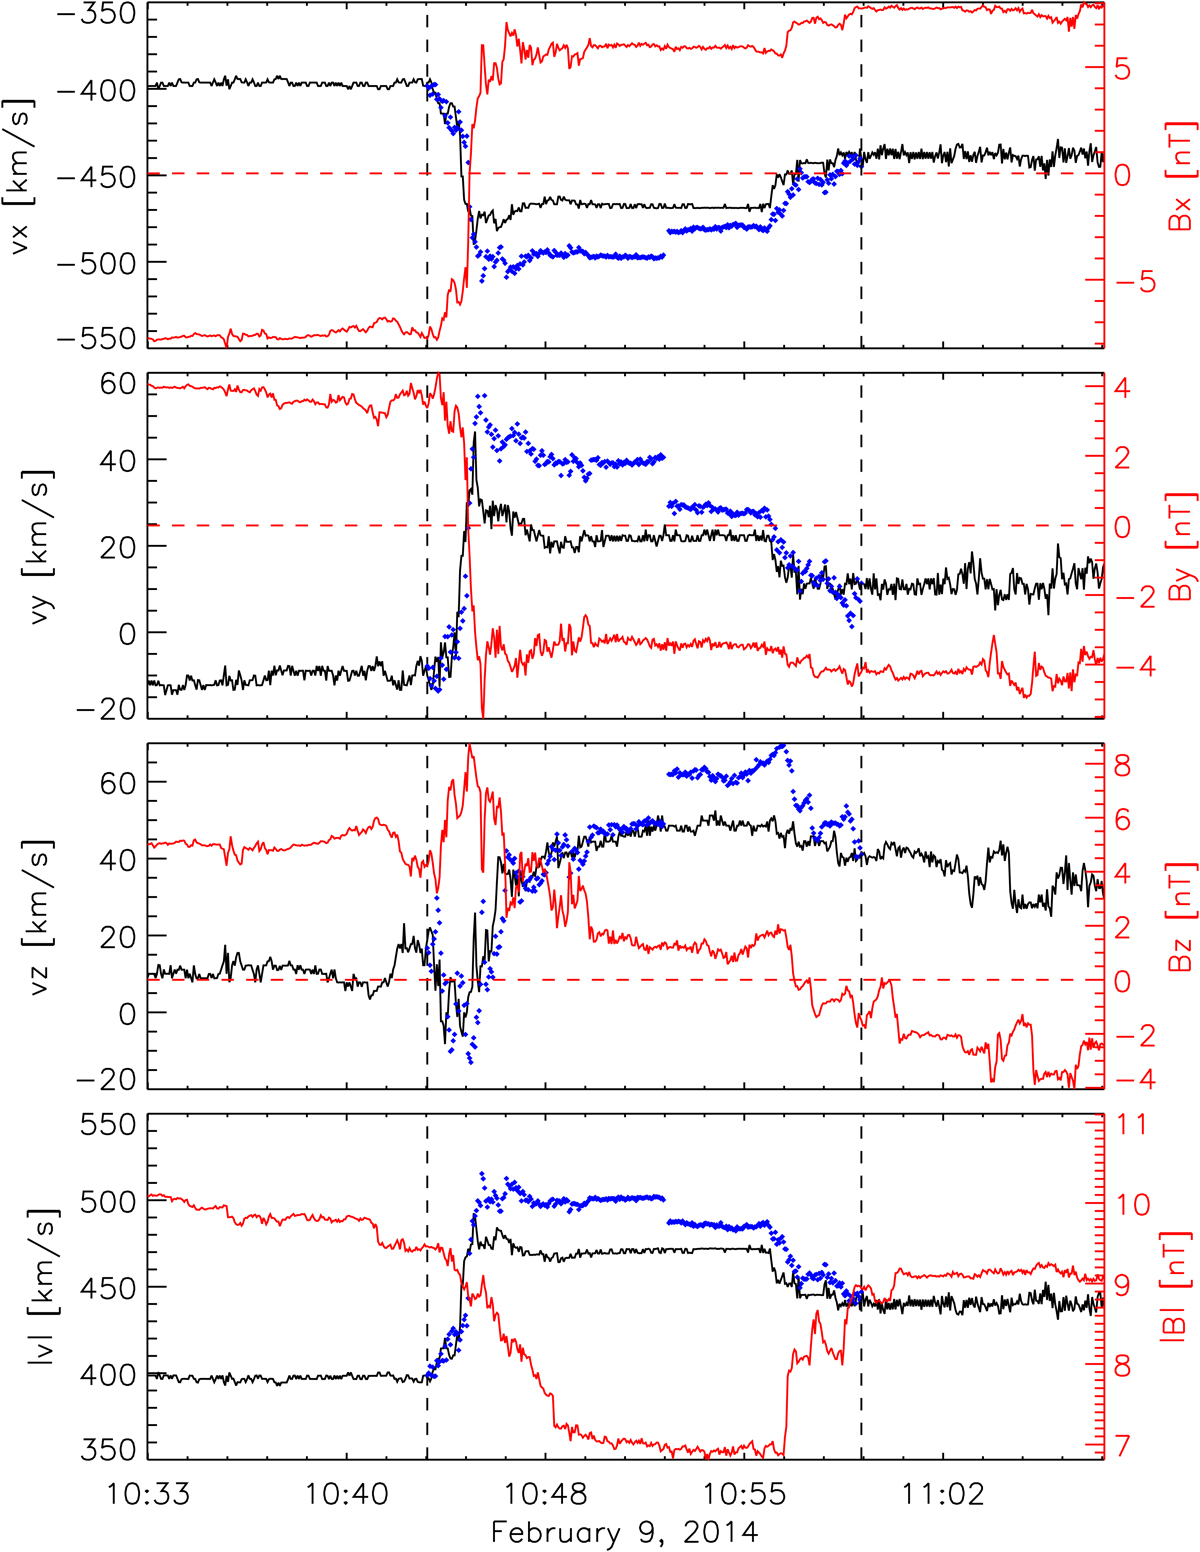
Walén test of the slow-mode wave at the interface of ICME and HSS. From top to bottom, the x, y, and z components and the absolute value of the proton velocity and magnetic field strength are given. In each panel, the black curve shows the measured value of the proton velocity, and the blue diamonds give the predicted value, as determined according to Eq. (2). The solid red curve shows the magnetic field strength, and the dashed red curve marks a field strength of 0. The vertical dashed black lines indicate the start and end time of the reconnection exhaust interval. The jump in the predicted velocity marks the center of the exhaust region, where the anticorrelation of the velocity and magnetic field components changes to correlation.
Current usage metrics show cumulative count of Article Views (full-text article views including HTML views, PDF and ePub downloads, according to the available data) and Abstracts Views on Vision4Press platform.
Data correspond to usage on the plateform after 2015. The current usage metrics is available 48-96 hours after online publication and is updated daily on week days.
Initial download of the metrics may take a while.