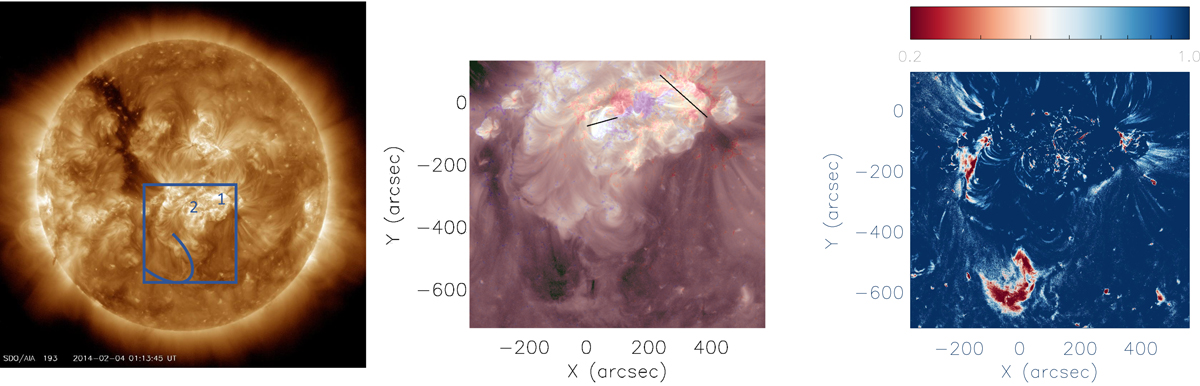
Fig. 1.
Download original image
Analysis of the solar corona during eruption. Left: AIA 193 Å image of the CME source region west of the disk center and the CH east of the center taken on 2014 February 4 at 01:13:45 UT. (1) denotes the location of the first flare (at 01:23 UT), and (2) indicates the location of the second flare (at 04:00 UT). The box marks the cutout used for the dimming analysis (Fig. 1). The arc inside this rectangle outlines the region that undergoes the strongest dimming in emission shortly after eruption. Center: AIA 211 Å and HMI magnetogram composite image of the region inside the box given in the left panel. In the magnetogram, red refers to positive values of the radial magnetic field strength, and blue shows negative values. The black lines give the approximate location of the polarity inversion line, located below bright arcs connecting regions of opposite polarity of the magnetic field strength. Right: logarithmic base-ratio image of the dimming region in 211 Å at 02:15 UT. The base reference image is taken on February 3 at 22:00 UT. Dark blue corresponds to a relative change of ≥100%, thus marking no change or increase in emission. Dark red is associated with the regions of strongest emission decrease, with a relative change of ≤ − 81%.
Current usage metrics show cumulative count of Article Views (full-text article views including HTML views, PDF and ePub downloads, according to the available data) and Abstracts Views on Vision4Press platform.
Data correspond to usage on the plateform after 2015. The current usage metrics is available 48-96 hours after online publication and is updated daily on week days.
Initial download of the metrics may take a while.