Fig. 5.
Download original image
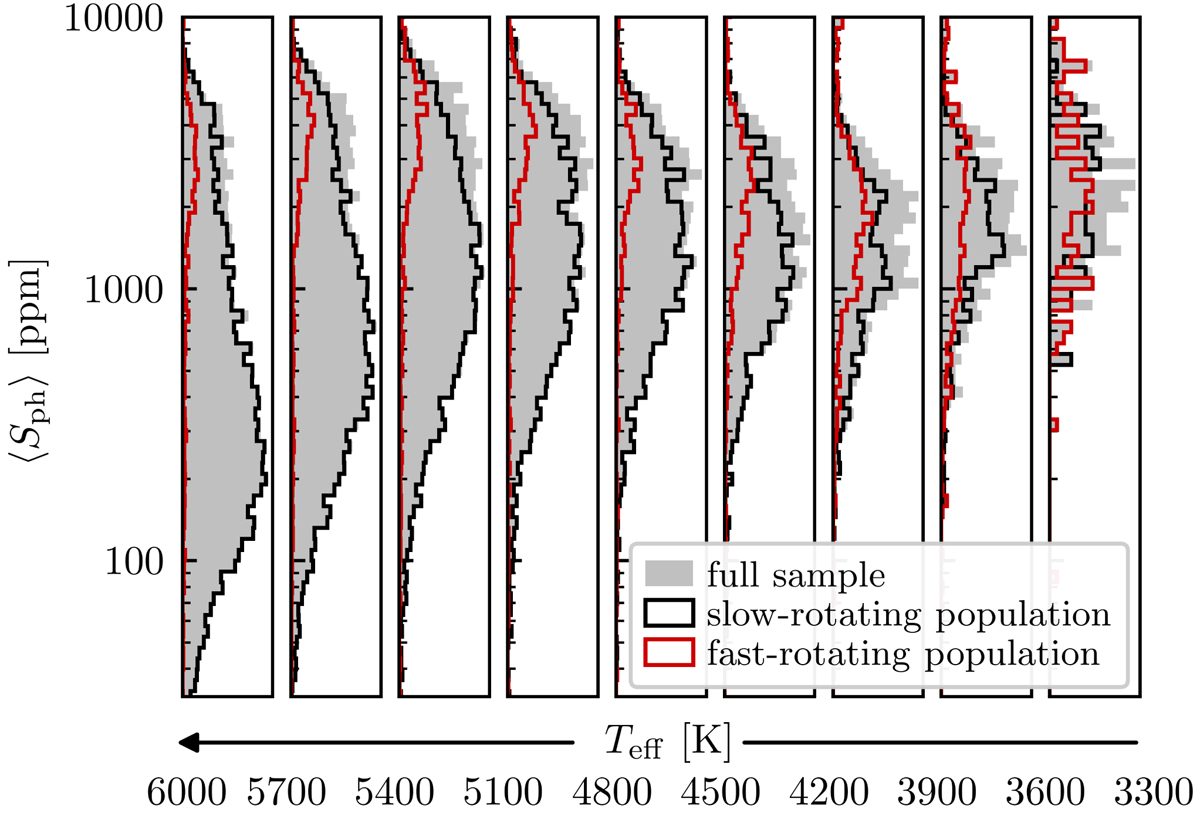
⟨Sph⟩ distribution in logarithmic scale for the GKM dwarfs, split into Teff intervals of 300 K. The gray shaded histogram shows the distribution for the full subsamples, while the solid black and red lines show the histograms for the slow- and fast-rotating populations, respectively. For clarity, the distributions here are shown by the actual histograms, while we opt for the KDE for the remainder.
Current usage metrics show cumulative count of Article Views (full-text article views including HTML views, PDF and ePub downloads, according to the available data) and Abstracts Views on Vision4Press platform.
Data correspond to usage on the plateform after 2015. The current usage metrics is available 48-96 hours after online publication and is updated daily on week days.
Initial download of the metrics may take a while.